IQ tests have an image problem. Sure, they remind some of defunct movements like state-sponsored eugenics, overturned legal and judicial regimes that allowed racial segregation, or suspicious research-funding organizations, like the Pioneer Fund. However, in the minds of most people, IQ tests denote a tribulation with greater immediacy: taking a test. The unpleasantness of test taking also pertains to the validity of test results. One class of criticisms of the tests concerns the potential for test anxiety to overwhelm an examinee, and since everyone has an equal ability to underperform by choice, a lack of motivation during challenging mental tasks also has the potential to confound. The latter concern underlines why the high-stakes SAT exam is so central to studying broad cross-sections of the American public.
I have just compiled what I consider the most comprehensive data set of national SAT scores anywhere on the Internet. I am now able to further expound on points that I
made in previous posts and share some equally startling new findings. The first reports on racial SAT score gaps occurred in 1976, but many years did not include corresponding standard deviations, which are necessary for calculating Cohen’s d. Cohen’s d is an expression of score gaps in the units of standard deviations. The SAT has undergone so many adjustments over the years that merely graphing raw scores without this statistical device would fail to edify. However, for completeness I shall post the raw score graphs here.


The verbal subtest became the critical reading subtest, following the addition of the writing subtest in 2006. In the early 80’s, the SAT briefly included a writing subtest on a radically different scale, and Cohen’s d can allow comparisons of writing subtest scores between that and the modern version.
Two equations by
Frey and Detterman allow the transformation of SAT scores into IQ score estimates. One of the equations serves those who took the test prior to the 1996 “recentering” of score allocation. The second equation for more recent scores resulted from a study sample with higher scores, so it is better suited for the higher score range. However, Mensans should be disappointed with both equations, since, as the following graphs of the full SAT range for both equations show, neither calculation can predict IQ scores greater than 130. Very intelligent people with high SAT scores will find
conversion tables more useful.


The equations do allow comparisons between groups, but the disparate interpretations of the average SAT score range between the two mathematical expressions overshadow the yearly trends, as shown in the following graph.

Frey and Detterman have
acknowledged that their second equation grossly underestimates IQ for the average student who takes the SAT.
As I previously wrote based on a more limited collection of data, the SAT gap between white and black students is large but used to be much larger and now seems to be slightly growing, again. The following graph is a 36-year illustration of this Cohen’s d gap. Years marked by dotted lines required estimates of the two groups’ respective standard deviations. These numbers are usually fairly constant, so I estimated them to be equal to those of 1981 for the years from 1976 to 1980. Likewise, I set the other estimated standard deviations to be halfway between those of the years that bookend each of those two periods.

The inflection point between the years of rapid progress for black students and the present stagnation seems to be around 1990.
Steve Sailer pointed to the crack epidemic, as well as increased black participation in SAT testing over the years and disparate rates of test preparation course usage. Actually, black, Hispanic, Asian, and Native-American students are all
more likely to employ test preparation courses than white students. Alternatively, one could posit that black students just happened to reach their intellectual potential at that time, causing genetic influences to overtake societal inequities, and one could explore the converse assumption that educational or economic racial progress suddenly reversed despite the magnificent bubble economy of the 90’s.
I would like to conjecture my own hypothesis. Baby-boomers often advance cultural biases centered on the music of their youth, which marked the beginning of civilization, of course. I do not believe that the production of music ended after The Beatles disbanded. In fact, whether music is an agent of change or a mere mirror, I consider the artistic landscape of the early 90’s to be highly relevant to this analysis. This was when buttrock hair bands scratched their heads as they stood in shock before the spectacle of dress-clad, (male) grunge rockers, who obsessively screeched anti-rape songs. Even the rip-roaring comedy of South Park stopped to declare
“Disintegration is the best album, ever,” referring to probably the most lugubrious (and greatest) contribution to the goth genre.
As white culture took a sudden turn towards introspection and sensitivity, black culture veered elsewhere. Not one for subtlety, in 1992 rapper
Ice Cube depicted himself literally kidnapping the feel-good, mainstream rapper MC Hammer and forcing him into a Kahlid “Kill the White Babies” Muhammad re-education camp. Via such proud celebration of a violent stereotype, rap music
surged from 4.2% of music sales in 1988 to 10.1% in 1997. Though the tumult surrounding the crack epidemic might have helped inspire gangsta rap, thug posturing remained frozen in time long after the decline of crack and materialized in a succession of martyrs, the most recent being the troubled, young Trayvon Martin. While I might suffer accusations of selecting a facile scapegoat, historians should acknowledge the lasting impact of what seems too obvious to contemporaries.
 Standing on the Shoulders of Giants
Black-white SAT score gaps dwarf those between male and female students. However, the case for macho anti-intellectualism as a chief detriment to black SAT scores coincides with a remarkable decline of those scores for black men relative to black women, as shown in these gender Cohen’s d gaps:


By contrast, the gaps between white men and white women have not changed so greatly over those three decades. Overall, women have had some improvement, at least on the mathematics subtest, despite increasing their participation faster than men did.


I have selected a narrow y-axis range to focus on the yearly trends in the previous graphs, but comparisons of different gaps benefit from having the axis range in common. All of the following graphs show the extent of white advantage over minorities, even though that is a mostly negative gap for high-achieving Asians.


These score gaps could be interpreted as white admixture tests. White students have SAT score advantages over all non-Asian minorities. The gaps shrink in order from African Americans to Hispanic Americans to Native Americans to “other” race students. This order seems to correspond to white admixture (African Americans:
22%, Hispanic Americans:
48%, Native American:
50-60%). Granted, those admixture estimates are debatable, and I am reluctant to draw strident conclusions related to the small, fluctuating number of students who call themselves Native-American on the SAT, let alone “others.”
I compiled this data set from multiple sources. (The online sources are
here,
here,
here,
here,
here,
here,
here,
here, and
here.) I confess some anomalies for the Hispanic data, which is a composite of data from Mexican Americans, Puerto Ricans, and those labeled “other Hispanics.” Unfortunately, my sources for Puerto Ricans slightly contradicted each other for the years 1981, 1982, 1984, and 1985, requiring a value judgment of trustworthiness. The College Board, which oversees the SAT, did not even create the “other Hispanic” category until 1987. Even so, the composite Hispanic data does not strike me as particularly noisy. Interestingly, the separate gaps for each of the three Hispanic groups seem to be converging after many years of Puerto Rican relative deficiency.


Yellow Peril
This complete collection of national SAT data reveals an even more dramatic degree of progress for Asians than I previously realized, particularly on the writing subtest. Asians have always had a mathematics advantage over whites, just as the black-white gap has always been larger for the mathematics subtest than the verbal subtest. After so many years of complaints of cultural bias on standardized tests, one would expect a complimentary appraisal of Asians’ near closing of the verbal score gap with whites. Instead, Sailer and many commenters seemed to reach for arguments to explain away Asian success: test prep courses game the SAT, Asian foreign students have started swamping the Asian Americans, or smarter Asians recently started immigrating. Whether test preparation constitutes “gaming” or learning I shall leave open to debate, but I feel confident that I can lay to rest the other disputes.
First, I shall graph the SAT participation levels of Asians, Hispanics, those who marked “other” for race, English-as-a-second-language (ESL) students, foreign students, US residents, and multilingual students. Residents are either US permanent residents or refugees to America. Foreign students are simply all students with foreign citizenship and who do not fit into the resident category. Students in my “multilingual” category grew up with English and another language.

Asians and Hispanics greatly outnumber foreign students and residents but not multilingual students or ESL students. One
study reported that 44% of Asians who took the test in 1991 were foreign students. Now, I shall graph the gaps between Americans and foreign students, with that graph overlaying for comparison the Asian-white gaps graph with its colors set to gray. I defined Americans as a composite of US citizens, permanent residents, and refugees.

The gaps for foreign students almost completely overlap the Asian-white gaps. Foreign students might slightly outperform Asian-Americans on the mathematics subtest but not so much that the smaller number of foreign students could significantly raise the scores of Asians. In fact, the foreign student-Asian mathematics gap disappears when the comparison group is changed from Americans to white students.

Resident students and ESL students can offer clues about Asian immigrants, even though they lack racial breakdowns. As one of the previous graphs illustrated, the number of Hispanics who take the SAT does not greatly outnumber the number of Asians who take the test despite the fact that Hispanic Americans are about three-and-a-half times more numerous than Asian Americans, according to the
latest Census figures. Plus, the contours of the gaps graphs for ESL students and resident students more closely tracks the Asian-white score gaps graph than a Hispanic-white gaps graph, which I shall include below with a more restricted axis range.


Though the inclusion of Hispanics in the ESL and resident student data probably contributes to some of the relative score weakness in comparison to white students, I think these graphs effectively falsify the notion that recent immigration explains away Asian progress.
Multilingual students further complicate this discussion. I shall post the ESL graph again next to a gaps graph for multilingual students.


If one ignored race and immigration status, one would only expect the multilingual students to have a greater advantage over ESL students because their only difference is the criterion of growing up with English. They have had a shrinking verbal score advantage, but the graphs seem to suggest that raising one’s children to be multilingual by adding English lowers math skills. More likely, ESL students have a greater probability of being math-oriented Asians. On the other hand, perhaps ESL students are more likely to be more capable recent immigrants, or multilingual students might have a greater likelihood of being 2nd- or 3rd-generation immigrants who experience a racialized IQ regression to the mean. I would argue against that because Asians outscore both ESL and multilingual students. Therefore, greater association with the United States and its language is not necessarily a hindrance.
White Decline?
Getting stumped on the first SAT question might not bode well, especially if that question is, “What is your race?” At the turn of the millennium, the SAT experienced a surge of underachievers who failed to respond to the race question. The surge seemed to precede major growth of black, Hispanic, and Asian SAT participation. Whereas the no-response surge seemed to coincide with a “bite” out of the white participation rate, the gradual growth of minority participation went uninterrupted through a no-response peak that towered over each group.

As the no-response peak passed, the SAT score gap between white students and non-responders shot up almost vertically.

Based on this data, I conclude that non-responders are an overwhelmingly white group of poor performers. Without detailed knowledge of SAT procedure, I cannot comment authoritatively on where the surge came from or why it went away. Was there a period of test administration that required students to fill out this data after they finished, if they had time or the inclination? A greater tendency to not respond must be associated with poorer testing ability because the declining remnants of the force behind the surge are now selecting for increasingly worse test takers. At first, I suspected that non-responders were conservative proponents of race-blindness or opponents of racial preferences.
Three recent studies have associated conservative tendencies with worse intellectual ability. However, race non-response exactly corresponds with surges for non-response to the language, citizenship, and reported average grade questions.

If my assumption that white students comprise the vast majority of non-responders is correct, then white students have significantly declined in their SAT participation just as minority participation is ramping up.

I decided to repeat my analysis, combining the white-student and non-responder data. This time, the trends calculated with whites by themselves are gray for comparison with the overlaid combined-group graphs.


While the changes might appear minor, the case for an increasing black-white SAT score gap has vanished, which becomes more evident in the following graph with a restricted y-axis range.

Similarly, any growth in the Hispanic-white gap barely escapes the yearly noise.

A long-held assumption of SAT results analysis holds that participation varies inversely with average performance. Usually, participation increases as more students who would not have been college material in a previous era pursue higher education and lower average SAT scores in the process. If we promote that assumption to a law of nature, then white students could be in serious relative decline, considering the Asian advancement, the non-respondent white score bubble, and declining white SAT participation when non-respondents are added to the white totals. Perhaps whites can take comfort in the fact that both Asians and, to some extent, women have broken this law by simultaneously increasing their scores and participation. Moreover, the assumption appears to be based upon a major SAT score decline from the late 60’s to early 70’s. Here are the raw scores and recentered scores graphs:


The enormous participation growth since the early 90’s has not further sunk SAT scores. Maybe the late 60’s decline resulted from listening to The Beatles. Maybe it was from listening to The Beatles high. Even the considerably left-wing psychologist Steven Pinker linked the 1960’s counterculture to a “decivilizing mindset.” The Woodstock Generation might have struck the logical balance between SAT preparation and making the most out of the last moments before the nuclear annihilation they were expecting. For its part, the College Board convened an advisory panel, which
reported in 1977 that two-thirds to three-fourths of the 1960’s decline was due to demographic changes, such as more minority participation, but this proportion fell to 30% or less for the 1970’s decline.
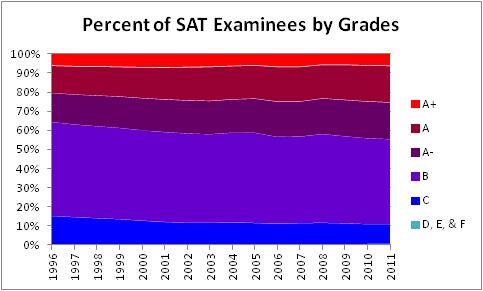
With regard to the presumptive white participation decline, the popping of an education bubble could be bearing an increasing proportion of smart, young white people skipping the college experience, even during this dismal economy. It could but probably is not. Superior high school class rank and self-reported average grade is now more associated with greater SAT participation, albeit amidst some grade inflation, judging by the raw SAT scores corresponding to each average grade since 1996.


Since white students are still such a high proportion of SAT examinees, their apparent stagnation rather than improvement during a period of probable declining white participation and increased participation of highly ranked students warrants concern.
In total, SAT trends offer a complex interpretation of societal changes plus new perplexities ripe for further study. My first suggestion to my fellow white people is to finally accept Asian Americans as a veritable model.
 Buchmann, C., Condron, D., & Roscigno, V. (2010). Shadow Education, American Style: Test Preparation, the SAT and College Enrollment Social Forces, 89 (2), 435-461 DOI: 10.1353/sof.2010.0105Eidelman S, Crandall CS, Goodman JA, & Blanchar JC (2012). Low-Effort Thought Promotes Political Conservatism. Personality & Social Psychology Bulletin PMID: 22427384Frey, M., & Detterman, D. (2005). Regression Basics: Rejoinder to Bridgeman Psychological Science, 16 (9), 747-747 DOI: 10.1111/j.1467-9280.2005.01607.xFrey, M., & Detterman, D. (2004). Scholastic Assessment or g?: The Relationship Between the Scholastic Assessment Test and General Cognitive Ability Psychological Science, 15 (6), 373-378 DOI: 10.1111/j.0956-7976.2004.00687.xHodson G, & Busseri MA (2012). Bright minds and dark attitudes: lower cognitive ability predicts greater prejudice through right-wing ideology and low intergroup contact. Psychological Science, 23 (2), 187-95 PMID: 22222219Hunley K, & Healy M (2011). The impact of founder effects, gene flow, and European admixture on native American genetic diversity. American Journal of Physical Anthropology, 146 (4), 530-8 PMID: 21913174Kanazawa, S. (2010). Why Liberals and Atheists Are More Intelligent Social Psychology Quarterly, 73 (1), 33-57 DOI: 10.1177/0190272510361602Price AL, Patterson N, Yu F, Cox DR, Waliszewska A, McDonald GJ, Tandon A, Schirmer C, Neubauer J, Bedoya G, Duque C, Villegas A, Bortolini MC, Salzano FM, Gallo C, Mazzotti G, Tello-Ruiz M, Riba L, Aguilar-Salinas CA, Canizales-Quinteros S, Menjivar M, Klitz W, Henderson B, Haiman CA, Winkler C, Tusie-Luna T, Ruiz-Linares A, & Reich D (2007). A Genomewide Admixture Map for Latino Populations. American Journal of Human Genetics, 80 (6), 1024-36 PMID: 17503322Sandia National Laboratories (1993). Perspectives on Education in America: College and University Data The Journal of Educational Research, 86 (5), 273-288 DOI: 10.1080/00220671.1993.9941211Stedman, L. (1994). The Sandia Report and U.S. Achievement: An Assessment The Journal of Educational Research, 87 (3), 133-146 DOI: 10.1080/00220671.1994.9941235Zakharia F, Basu A, Absher D, Assimes TL, Go AS, Hlatky MA, Iribarren C, Knowles JW, Li J, Narasimhan B, Sidney S, Southwick A, Myers RM, Quertermous T, Risch N, & Tang H (2009). Characterizing the admixed African ancestry of African Americans. Genome Biology, 10 (12) PMID: 20025784


 Though the verbal and writing subtests might not elicit a Pavlovian reaction to bell curves, this seems to result from the test range chopping the black students’ curves into wedges. If the true IQ distribution of African Americans follows a bell-shaped Gaussian curve, then an artificial minimum SAT score could be misrepresenting the full ability spectrum of black students.
 This does not convince me that the same occurred for actual post-recentering black SAT scores because the black-white gap remained virtually unchanged.


 Notice that the percentages with the highest scores continued to increase even after the recentering, especially on the mathematics subtest.


 As the standard deviations graph above already revealed, Asians comprise the most heterogeneous group, and I find their distribution to be the most fascinating.


 The most obvious characteristic of the verbal and writing graphs are the bimodal distributions, which one would expect in a group for whom English frequently is the second language. This matches the writing subtest distribution for Hispanics below, but the Asian verbal subtest graph has one other aspect lacking in the Hispanic counterpart. Despite the large number of poor performers on the left side, the most elite performers of the Asian graph appear to present in roughly equal proportion to those of the white graph. In fact, a slightly higher proportion of Asians achieved the highest two verbal score ranges compared to the white group for each of the four years, and these were years prior to most of the Asian score improvement that I previously discussed.


 A 2006 no-confidence vote compelled Larry Summers to resign from his position as president of Harvard because he gave a speech in which he said the following:

 Dr. Summers, on behalf of Harvard University, I would like to offer you your job back.