
I have just compiled what I consider the most comprehensive data set of national SAT scores anywhere on the Internet. I am now able to further expound on points that I made in previous posts and share some equally startling new findings. The first reports on racial SAT score gaps occurred in 1976, but many years did not include corresponding standard deviations, which are necessary for calculating Cohen’s d. Cohen’s d is an expression of score gaps in the units of standard deviations. The SAT has undergone so many adjustments over the years that merely graphing raw scores without this statistical device would fail to edify. However, for completeness I shall post the raw score graphs here.


The verbal subtest became the critical reading subtest, following the addition of the writing subtest in 2006. In the early 80’s, the SAT briefly included a writing subtest on a radically different scale, and Cohen’s d can allow comparisons of writing subtest scores between that and the modern version.
Two equations by Frey and Detterman allow the transformation of SAT scores into IQ score estimates. One of the equations serves those who took the test prior to the 1996 “recentering” of score allocation. The second equation for more recent scores resulted from a study sample with higher scores, so it is better suited for the higher score range. However, Mensans should be disappointed with both equations, since, as the following graphs of the full SAT range for both equations show, neither calculation can predict IQ scores greater than 130. Very intelligent people with high SAT scores will find conversion tables more useful.


The equations do allow comparisons between groups, but the disparate interpretations of the average SAT score range between the two mathematical expressions overshadow the yearly trends, as shown in the following graph.

Frey and Detterman have acknowledged that their second equation grossly underestimates IQ for the average student who takes the SAT.
As I previously wrote based on a more limited collection of data, the SAT gap between white and black students is large but used to be much larger and now seems to be slightly growing, again. The following graph is a 36-year illustration of this Cohen’s d gap. Years marked by dotted lines required estimates of the two groups’ respective standard deviations. These numbers are usually fairly constant, so I estimated them to be equal to those of 1981 for the years from 1976 to 1980. Likewise, I set the other estimated standard deviations to be halfway between those of the years that bookend each of those two periods.

The inflection point between the years of rapid progress for black students and the present stagnation seems to be around 1990. Steve Sailer pointed to the crack epidemic, as well as increased black participation in SAT testing over the years and disparate rates of test preparation course usage. Actually, black, Hispanic, Asian, and Native-American students are all more likely to employ test preparation courses than white students. Alternatively, one could posit that black students just happened to reach their intellectual potential at that time, causing genetic influences to overtake societal inequities, and one could explore the converse assumption that educational or economic racial progress suddenly reversed despite the magnificent bubble economy of the 90’s.
I would like to conjecture my own hypothesis. Baby-boomers often advance cultural biases centered on the music of their youth, which marked the beginning of civilization, of course. I do not believe that the production of music ended after The Beatles disbanded. In fact, whether music is an agent of change or a mere mirror, I consider the artistic landscape of the early 90’s to be highly relevant to this analysis. This was when buttrock hair bands scratched their heads as they stood in shock before the spectacle of dress-clad, (male) grunge rockers, who obsessively screeched anti-rape songs. Even the rip-roaring comedy of South Park stopped to declare “Disintegration is the best album, ever,” referring to probably the most lugubrious (and greatest) contribution to the goth genre.
As white culture took a sudden turn towards introspection and sensitivity, black culture veered elsewhere. Not one for subtlety, in 1992 rapper Ice Cube depicted himself literally kidnapping the feel-good, mainstream rapper MC Hammer and forcing him into a Kahlid “Kill the White Babies” Muhammad re-education camp. Via such proud celebration of a violent stereotype, rap music surged from 4.2% of music sales in 1988 to 10.1% in 1997. Though the tumult surrounding the crack epidemic might have helped inspire gangsta rap, thug posturing remained frozen in time long after the decline of crack and materialized in a succession of martyrs, the most recent being the troubled, young Trayvon Martin. While I might suffer accusations of selecting a facile scapegoat, historians should acknowledge the lasting impact of what seems too obvious to contemporaries.

Black-white SAT score gaps dwarf those between male and female students. However, the case for macho anti-intellectualism as a chief detriment to black SAT scores coincides with a remarkable decline of those scores for black men relative to black women, as shown in these gender Cohen’s d gaps:


By contrast, the gaps between white men and white women have not changed so greatly over those three decades. Overall, women have had some improvement, at least on the mathematics subtest, despite increasing their participation faster than men did.


I have selected a narrow y-axis range to focus on the yearly trends in the previous graphs, but comparisons of different gaps benefit from having the axis range in common. All of the following graphs show the extent of white advantage over minorities, even though that is a mostly negative gap for high-achieving Asians.


These score gaps could be interpreted as white admixture tests. White students have SAT score advantages over all non-Asian minorities. The gaps shrink in order from African Americans to Hispanic Americans to Native Americans to “other” race students. This order seems to correspond to white admixture (African Americans: 22%, Hispanic Americans: 48%, Native American: 50-60%). Granted, those admixture estimates are debatable, and I am reluctant to draw strident conclusions related to the small, fluctuating number of students who call themselves Native-American on the SAT, let alone “others.”
I compiled this data set from multiple sources. (The online sources are here, here, here, here, here, here, here, here, and here.) I confess some anomalies for the Hispanic data, which is a composite of data from Mexican Americans, Puerto Ricans, and those labeled “other Hispanics.” Unfortunately, my sources for Puerto Ricans slightly contradicted each other for the years 1981, 1982, 1984, and 1985, requiring a value judgment of trustworthiness. The College Board, which oversees the SAT, did not even create the “other Hispanic” category until 1987. Even so, the composite Hispanic data does not strike me as particularly noisy. Interestingly, the separate gaps for each of the three Hispanic groups seem to be converging after many years of Puerto Rican relative deficiency.


Yellow Peril
This complete collection of national SAT data reveals an even more dramatic degree of progress for Asians than I previously realized, particularly on the writing subtest. Asians have always had a mathematics advantage over whites, just as the black-white gap has always been larger for the mathematics subtest than the verbal subtest. After so many years of complaints of cultural bias on standardized tests, one would expect a complimentary appraisal of Asians’ near closing of the verbal score gap with whites. Instead, Sailer and many commenters seemed to reach for arguments to explain away Asian success: test prep courses game the SAT, Asian foreign students have started swamping the Asian Americans, or smarter Asians recently started immigrating. Whether test preparation constitutes “gaming” or learning I shall leave open to debate, but I feel confident that I can lay to rest the other disputes.
First, I shall graph the SAT participation levels of Asians, Hispanics, those who marked “other” for race, English-as-a-second-language (ESL) students, foreign students, US residents, and multilingual students. Residents are either US permanent residents or refugees to America. Foreign students are simply all students with foreign citizenship and who do not fit into the resident category. Students in my “multilingual” category grew up with English and another language.

Asians and Hispanics greatly outnumber foreign students and residents but not multilingual students or ESL students. One study reported that 44% of Asians who took the test in 1991 were foreign students. Now, I shall graph the gaps between Americans and foreign students, with that graph overlaying for comparison the Asian-white gaps graph with its colors set to gray. I defined Americans as a composite of US citizens, permanent residents, and refugees.

The gaps for foreign students almost completely overlap the Asian-white gaps. Foreign students might slightly outperform Asian-Americans on the mathematics subtest but not so much that the smaller number of foreign students could significantly raise the scores of Asians. In fact, the foreign student-Asian mathematics gap disappears when the comparison group is changed from Americans to white students.

Resident students and ESL students can offer clues about Asian immigrants, even though they lack racial breakdowns. As one of the previous graphs illustrated, the number of Hispanics who take the SAT does not greatly outnumber the number of Asians who take the test despite the fact that Hispanic Americans are about three-and-a-half times more numerous than Asian Americans, according to the latest Census figures. Plus, the contours of the gaps graphs for ESL students and resident students more closely tracks the Asian-white score gaps graph than a Hispanic-white gaps graph, which I shall include below with a more restricted axis range.


Though the inclusion of Hispanics in the ESL and resident student data probably contributes to some of the relative score weakness in comparison to white students, I think these graphs effectively falsify the notion that recent immigration explains away Asian progress.
Multilingual students further complicate this discussion. I shall post the ESL graph again next to a gaps graph for multilingual students.


If one ignored race and immigration status, one would only expect the multilingual students to have a greater advantage over ESL students because their only difference is the criterion of growing up with English. They have had a shrinking verbal score advantage, but the graphs seem to suggest that raising one’s children to be multilingual by adding English lowers math skills. More likely, ESL students have a greater probability of being math-oriented Asians. On the other hand, perhaps ESL students are more likely to be more capable recent immigrants, or multilingual students might have a greater likelihood of being 2nd- or 3rd-generation immigrants who experience a racialized IQ regression to the mean. I would argue against that because Asians outscore both ESL and multilingual students. Therefore, greater association with the United States and its language is not necessarily a hindrance.
White Decline?
Getting stumped on the first SAT question might not bode well, especially if that question is, “What is your race?” At the turn of the millennium, the SAT experienced a surge of underachievers who failed to respond to the race question. The surge seemed to precede major growth of black, Hispanic, and Asian SAT participation. Whereas the no-response surge seemed to coincide with a “bite” out of the white participation rate, the gradual growth of minority participation went uninterrupted through a no-response peak that towered over each group.

As the no-response peak passed, the SAT score gap between white students and non-responders shot up almost vertically.

Based on this data, I conclude that non-responders are an overwhelmingly white group of poor performers. Without detailed knowledge of SAT procedure, I cannot comment authoritatively on where the surge came from or why it went away. Was there a period of test administration that required students to fill out this data after they finished, if they had time or the inclination? A greater tendency to not respond must be associated with poorer testing ability because the declining remnants of the force behind the surge are now selecting for increasingly worse test takers. At first, I suspected that non-responders were conservative proponents of race-blindness or opponents of racial preferences. Three recent studies have associated conservative tendencies with worse intellectual ability. However, race non-response exactly corresponds with surges for non-response to the language, citizenship, and reported average grade questions.

If my assumption that white students comprise the vast majority of non-responders is correct, then white students have significantly declined in their SAT participation just as minority participation is ramping up.

I decided to repeat my analysis, combining the white-student and non-responder data. This time, the trends calculated with whites by themselves are gray for comparison with the overlaid combined-group graphs.


While the changes might appear minor, the case for an increasing black-white SAT score gap has vanished, which becomes more evident in the following graph with a restricted y-axis range.

Similarly, any growth in the Hispanic-white gap barely escapes the yearly noise.

A long-held assumption of SAT results analysis holds that participation varies inversely with average performance. Usually, participation increases as more students who would not have been college material in a previous era pursue higher education and lower average SAT scores in the process. If we promote that assumption to a law of nature, then white students could be in serious relative decline, considering the Asian advancement, the non-respondent white score bubble, and declining white SAT participation when non-respondents are added to the white totals. Perhaps whites can take comfort in the fact that both Asians and, to some extent, women have broken this law by simultaneously increasing their scores and participation. Moreover, the assumption appears to be based upon a major SAT score decline from the late 60’s to early 70’s. Here are the raw scores and recentered scores graphs:


The enormous participation growth since the early 90’s has not further sunk SAT scores. Maybe the late 60’s decline resulted from listening to The Beatles. Maybe it was from listening to The Beatles high. Even the considerably left-wing psychologist Steven Pinker linked the 1960’s counterculture to a “decivilizing mindset.” The Woodstock Generation might have struck the logical balance between SAT preparation and making the most out of the last moments before the nuclear annihilation they were expecting. For its part, the College Board convened an advisory panel, which reported in 1977 that two-thirds to three-fourths of the 1960’s decline was due to demographic changes, such as more minority participation, but this proportion fell to 30% or less for the 1970’s decline.
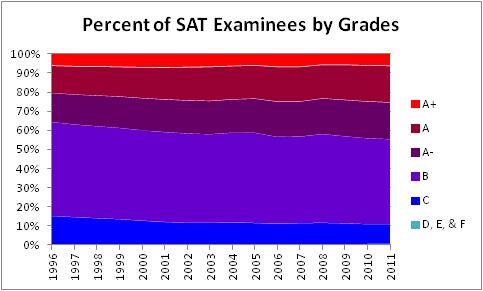
With regard to the presumptive white participation decline, the popping of an education bubble could be bearing an increasing proportion of smart, young white people skipping the college experience, even during this dismal economy. It could but probably is not. Superior high school class rank and self-reported average grade is now more associated with greater SAT participation, albeit amidst some grade inflation, judging by the raw SAT scores corresponding to each average grade since 1996.


Since white students are still such a high proportion of SAT examinees, their apparent stagnation rather than improvement during a period of probable declining white participation and increased participation of highly ranked students warrants concern.
In total, SAT trends offer a complex interpretation of societal changes plus new perplexities ripe for further study. My first suggestion to my fellow white people is to finally accept Asian Americans as a veritable model.
Buchmann, C., Condron, D., & Roscigno, V. (2010). Shadow Education, American Style: Test Preparation, the SAT and College Enrollment Social Forces, 89 (2), 435-461 DOI: 10.1353/sof.2010.0105
Eidelman S, Crandall CS, Goodman JA, & Blanchar JC (2012). Low-Effort Thought Promotes Political Conservatism. Personality & Social Psychology Bulletin PMID: 22427384
Frey, M., & Detterman, D. (2005). Regression Basics: Rejoinder to Bridgeman Psychological Science, 16 (9), 747-747 DOI: 10.1111/j.1467-9280.2005.01607.x
Frey, M., & Detterman, D. (2004). Scholastic Assessment or g?: The Relationship Between the Scholastic Assessment Test and General Cognitive Ability Psychological Science, 15 (6), 373-378 DOI: 10.1111/j.0956-7976.2004.00687.x
Hodson G, & Busseri MA (2012). Bright minds and dark attitudes: lower cognitive ability predicts greater prejudice through right-wing ideology and low intergroup contact. Psychological Science, 23 (2), 187-95 PMID: 22222219
Hunley K, & Healy M (2011). The impact of founder effects, gene flow, and European admixture on native American genetic diversity. American Journal of Physical Anthropology, 146 (4), 530-8 PMID: 21913174
Kanazawa, S. (2010). Why Liberals and Atheists Are More Intelligent Social Psychology Quarterly, 73 (1), 33-57 DOI: 10.1177/0190272510361602
Price AL, Patterson N, Yu F, Cox DR, Waliszewska A, McDonald GJ, Tandon A, Schirmer C, Neubauer J, Bedoya G, Duque C, Villegas A, Bortolini MC, Salzano FM, Gallo C, Mazzotti G, Tello-Ruiz M, Riba L, Aguilar-Salinas CA, Canizales-Quinteros S, Menjivar M, Klitz W, Henderson B, Haiman CA, Winkler C, Tusie-Luna T, Ruiz-Linares A, & Reich D (2007). A Genomewide Admixture Map for Latino Populations. American Journal of Human Genetics, 80 (6), 1024-36 PMID: 17503322
Sandia National Laboratories (1993). Perspectives on Education in America: College and University Data The Journal of Educational Research, 86 (5), 273-288 DOI: 10.1080/00220671.1993.9941211
Stedman, L. (1994). The Sandia Report and U.S. Achievement: An Assessment The Journal of Educational Research, 87 (3), 133-146 DOI: 10.1080/00220671.1994.9941235
Zakharia F, Basu A, Absher D, Assimes TL, Go AS, Hlatky MA, Iribarren C, Knowles JW, Li J, Narasimhan B, Sidney S, Southwick A, Myers RM, Quertermous T, Risch N, & Tang H (2009). Characterizing the admixed African ancestry of African Americans. Genome Biology, 10 (12) PMID: 20025784


38 comments:
Wow. Lots of great stuff here.
OK, why would increasing participation not lead to lower average scores?
One possibility would be a secular increase in scores from the Flynn Effect, more test prep, fewer hangovers, or whatever.
Another possibility is that the talent pool isn't really bell-shaped, it's more pyramid shaped. In major league baseball, for example, the number of marginal players is huge compared to the number of above average players. Presumably, that's just the right end of the bell curve in baseball skill.
I hate to come up with more work for you to do, but I'm wondering about whether high scores (e.g., 700 or 650 or 600) have proliferated in recent years. It seems like they are becoming more common in math, but less so in verbal. I think the growth is mostly in absolute terms because ETS keeps pushing more mediocre black and Hispanic students to take the SAT.
Here's another question: everybody who is anybody is pushing for more blacks to take the SAT. Are they finding more black high scorers who didn't take the SAT in the past? Everybody is in favor of finding all the diamonds in the rough, but it would be interesting to find out how many were overlooked a few decades ago.
A big problem here is the growing overlap between SAT and ACT test-takers. It used to be that kids in Iowa all took the ACT, except for the super-ambitious, while everybody in New Jersey and California took the SAT. But now lots of kids take both trying to get an edge in college admissions. This might be especially true for moderately high scorers, ambitious kids who do pretty good on either the SAT or ACT but don't max out, then switch and take the other test to claw their way up. This leads to doublecounting of test-takers. So, an absolute count of, say, blacks averaging 600 or higher would increase over time due to more middle of the country blacks taking the SAT, while a relative count might fall due to ETS handing out free SAT tickets to more poor black kids.
Maybe if you just looked at one SAT-dominated state over time, such as California or New York and compared absolute count of high scores to number of black 17 year olds from the Census, that might give us the best perspective.
First, very impresive work; thanks for doing it.
Second, while I haven't yet read your entire ... compendium here, I would nevertheless like to ask a quick question, if I may:
Do you have any recent data that would substantiate past comparison results such as these given here in La Griffe's STANDARDIZED TESTS: THE INTERPRETATION OF RACIAL AND ETHNIC GAPS
Black children from the wealthiest families have mean SAT scores lower than white children from families below the poverty line.
Black children of parents with graduate degrees have lower SAT scores than white children of parents with a high-school diploma or less.
Thanks in advance.
Have you thought of doing this but looking at Britain and it's standardized tests like GCSE and CAT? Chuck at Occidental Ascent says that the racial gaps in Britain appear to be tiny.
Good stuff. A few comments:
1) I'm glad to see Steve mention the ACT. The ACT is required by several states. I don't think the SAT is required by any state, but I might have missed an announcement. It'd be interesting to see the test gap in states like Illinois and Colorado, comparing the ACT gap (required) to the SAT gap (not required).
2) On Steve's question about higher scores. That's my sense, too. However, one of the things the 2005 changes did was increase the impact of one missed question. The test got weirdly easier (fewer really hard questions) but harder (impact of one mistake increased). I don't think it's even possible to get a 790 or 780 on the math test--but that's a guess, not an assertion.
3) In answer to Steve's question #3: no. I'd expect to find diamonds in the ACT before the SAT, though.
4) On the Asian rise: I live in California. It is impossible to understand what people like me mean by "Asian test prep" unless you live in one of the areas where it exists. So unless you see "SAT academies" on every street corner, sometimes 3 to a building, and realize that each of those business is selling a minimum of 50-70 hours of test prep per kid, it might be difficult to understand. Kaplan has largely disappeared in my neck of the woods. Whites in my area are doing far, far less test prep. I don't know why specifically, but I suspect that many of them have realized that grades determine so much of UC admissions that there's no point in paying for a higher test score. A 2400 SAT scorer with a 3.8 GPA has zero chance at Berkeley, UCLA, and UCSD.
You've mentioned that the SAT has no ability to predict IQs over 130. This is consistent with my observations (anecdotal though they are) and it also suggests, I think, that it would be possible for the Asians to achieve overrepresentation through test prep. This does not have to mean that Asians would be schlubs without test prep, of course.
And can I just say, why include the Trayvon flipping off picture? It makes it harder to use this post as a reference. It would be so nice if the people who did this work would keep these particular posts free of viewpoints that make it easier for the ignorant to blow off the data.
There seems to be a lack of consistency in your graph labels.
If a label says X-Y Score Gap, I would expect that if (X-Y) > 0, it would be shown as positive, and if (X-Y) < 0, it would be shown as negative, but you seem to do it the other way around in places.
Also, just as it is three-day weekend (not three-days weekend), surely it should be gap graphs, not gaps graphs.
Like others said, great job! Thanks. What program were you using for graphing?
What troubles me is that Asians do so well on tests but so average in the real world. Not poorly, mind you, but surely less than you would expect based on their test scores.
This is puzzling and disturbing.
One, it points to the limitations of our tests. Entire dimensions of intellectual performance seem not to be captured on IQ or SATs, and the predictive power of these tests seem to fail in measuring some very important aspects of performance.
So psychometrics seems to be still an incomplete science at best. There is much about intellectual performance that it seems unable to capture.
The standard explanations for Asian underperformance that look at personality fail to really make sense , at least in America - here, Asians are very motivated, and encouraged by their environment, to make original contributions, yet fail to do so.
I think at this late point in the day we have no choice but to accept that Asian underperformance is a cognitive limitation, not a personality quirk, and that psychometric tools are imperfect.
In any event, THE most fascinating question to me is the gap between Asian test scores and real world performance.
To me, that is THE puzzle that needs explaining. It is the largest mystery. We should focus on THAT.
None of the other *gaps* pose anything like the same puzzle.
A related question would be why countries with relatively low IQ profiles, like Israel and France, are fertile in geniuses, and countries with relatively high IQ profiles, like the Scandinavian countries, are not.
It seems clear to me that entire dimensions of cognitive function are not captured by such tests. That seems to me the most parsimonious explanation. The appeal to personality seems to violate Occams razor.
I would be interested in the top scores too. Recently there was a paper using the PSAT to measure the gifted, finding over 30ish years a very small net gain due to math increases (offset by falls in verbal scores).
I agree with Mitch above. There is some great data in here but the picture of Trayvon, along with the extremely tenuous argument about rap music that accompanies the picture, makes this whole post easy to dismiss.
@ Steve Sailer
Charles Murray recently said that the SAT only started impacting Ivy League universities significantly during the 1950’s and that the average SAT scores of their students were low at first (somehow, despite higher overall SAT scores in 1941). For a number of statements Murray has made, I think he overestimates the meritocracy, and I suspect that a dwindling pool of smart, uneducated people still exists. Also, the SAT is not Raven’s Progressive Matrices, so the suggestions you made, as well as just more old-fashioned learning, could help explain many of the SAT trends.
I could update the post with distribution graphs. I believe that distribution tables for the different racial/ethnic groups only exist for the years 1981, 1982, 1984, and 1985. I haven’t yet checked SAT scores by state or the ACT. If you read the discussion of the 1996 recentering, there is an element of artificiality to allocating top scores. The College Board wanted to massage a good distribution without changing the rank order of the students.
@ eh
Thanks for the link. Yearly SAT reports do not break down racial scores by income. I am not yet sure where that report received its data.
@ Anonymous #1
I saw Chuck’s post, but I have not yet worked with Britain’s data. It is a good suggestion.
@ Mitch
I have to correct you that I did not say that **the SAT** fails to predict IQs over 130. I only said that the SAT-IQ conversion equations by Frey and Detterman do not include IQs that high. You can still use SAT scores to join Mensa, but you have to convert the score with a table, at least until someone develops better equations.
Personally, I think the graphs are more potentially offensive than the photograph, but you should not use anything from my blog as a reference, if you would not like to offend. Most of the data is available elsewhere, so you can go to the primary source.
@ Anonymous #2
For the graph names, I followed the defense-against-unconscious-bias convention. I am white, so non-whites go first, except for “other” and “foreigner.” Feel free to re-post the graphs with altered labels.
How did an English major get here? For your information, “three-day” is an adjectival phrase. If I say, “white-foreigner SAT score gaps graph,” and “white-foreigner SAT scores gaps” is an adjectival phrase, then hyphens should be between each word, but it is not a true adjectival phrase. If one graphs the number of alligators in one’s swimming pool, one would certainly call it an “alligators graph,” and more than one would be “alligators graphs.” How ridiculous would it be to have “alligator graphs”! :)
@ jon
It is just Microsoft Excel.
@ Jeff & Anonymous #3
There is a body of scientific literature linking IQ to performance. I agree with much of what you say about the limitations of IQ tests, but I think that line of reasoning has led to tests that de-emphasize fluid IQ. Crystallized IQ puts the tester in power of what body of knowledge has value and I think often unduly punishes intellectual independence.
Here is a handy chart that I found on the net that compares various test scores and IQ.
http://www.assessmentpsychology.com/iq.htm
Family income is not something that all 17-year-olds know reliably, so it's not regularly collected.
I disagree with many of your interpretations but thanks for your work in putting all of this online; this is what blogging should be about.
Family income is not something that all 17-year-olds know reliably, so it's not regularly collected.
Maybe it isn't collected regularly, but any 17 y/o who is smart enough to be taking the SAT ought to also have a rough but also roughly accurate -- i.e. within some reasonable range -- idea of how much his parents make. I did. The ranges can be chosen carefully enough so that the results are accurate enough for the kind of comparison suggested. This can even be quickly tested and verified beforehand.
That said, I don't recall if this question was asked when I took the SAT or not. But like I said I had a good idea.
Yearly SAT reports do offer reported family income for the SAT-taking population, as a whole. I could graph SAT score by income, but I doubt it would meet my standards for shocking revelations.
@eh
I've analyzed STAR (California) data by race and poverty and created a PDF with the results.
2011 STAR results by race and economic status:
http://depositfiles.com/files/8jpgerl85
or
http://pdfcast.org/pdf/2011-star-test-results-by-race
Whites outperform blacks in all 21 subjects in each economic category. Whites who are economically disadvantaged outperform blacks who are not economically disadvantaged in 20 out of 21 subjects.
Impressive work. If you have time you may be interested in Chuck's query about PISA data.
http://occidentalascent.wordpress.com/2012/04/15/data-please/
The SAT isn't a good predictor of much besides the ability to memorize vocab words and do basic algebra. Asian kids outperform everyone on the SAT because their parents hand them flash cards at age 14 and make them start memorizing; not really a mystery. The IQ/SAT conversion chart is also unrealistic and is seriously exaggerating IQ - do you really think scoring in the 99th percentile on the SAT translates to a very high IQ? Not in my experience. My IQ is nowhere near the estimate on that chart.
There are several things at stake here. First, about 40 % or so of Hispanics see themselves as 'white'.
If I want to see the raw white score, I want to see the raw North European score. Undiluted. Everyone else, Semitic or Mediterreanian, are a distraction.
The best test scores are in Finland, slightly beating South Korea. This despite the fact that South Korean children test practice and do homework far, far more than their Finnish counterparts.
But Finland is a 99 % homogenous Northern European country. Today, if you're Lebanese, you're counted as 'white' according to the Census. Ditto for anyone who wants to join in.
Second: Yes, preparation does still matter. It has shown to increase a SAT score by about 100 on average. That's not inconsistent.
Third: Asian quality is to a large extent derived from gifted immigrant parents.
The most extreme case is Indian-Americans. They come from the elite 1 % caste in India which dominates the country(I don't rememeber the name) but they represent close to 50 % of all American Indians - a huge overrepresentation.
Fourth: Despite all this, there is no doubt of a decline in white discipline and work ethic. Just look at average hours worked in the West going 50 years back. They are on a huge secular decline.
Still, Finland, folks. Finland. Many other European nations are today so multicultural so you can't get a clean picture. But I wouldn't be surprised if the students of, say, Holland or Germany (who were 100 % ethnically European) were not far behind if even on par with their Finnish compatriots.
Fifth: I agree with an earlier commenter. Asian underachievement in the 'real world' is bizarre. Look at Graduate school, for instance. Take Cal Tech. At undergrad, there are slightly more Asians than Whites. At Graduate school Asians fall to 11 % and there are almost 50% whites.
There was a gifted Asian-American author professor who wrote about this a year ago or so in NYT, where he said that many Asians are too shy once they're in the workplace. But from what I've heard, once they do get into the workplace it's not just social convention but actual work quality too that's average. Not bad by any stretch but not exactly linear with the test scores.
What this means is anybody's guess.
The College Board stopped publishing race by income SAT data around 1995. They have these data, because they publish income and race data separately, but they're withholding them, probably because those charts where poor whites outscore rich blacks look very thoughtcrime-y.
SAT scores are about equally predictive for whites and Asians: http://infoproc.blogspot.com/2011/12/differential-validity-of-sat.html. That means that SAT scores are valid predictors of Asian achievement as well.
Asian underachievement in the 'real world' is bizarre. Look at Graduate school, for instance. Take Cal Tech. At undergrad, there are slightly more Asians than Whites. At Graduate school Asians fall to 11 % and there are almost 50% whites.
What? Who are those 39 percent in Cal Tech who are neither white or Asian?
I don't think Asian underachievement, to the extent that's even a real phenomenon, suggest that psychometrics is faulty. There is much more to success than cognitive ability.
nooffensebut: Do you have an email? I have some followup analysis I'd like to share with you offline.
Sure.
My email is:
n00ffensebut@gmail.com
(the 0's are zeros)
obviously performance in the real world and performance on tests of cognitive ability are jointly determined by native cognitive ability, motivation, values and other factors. Given twins studies, you have to concoct pretty elaborate selection bias stories in order to deny that there is a genetic component to cognitive ability. But once you get into comparing races you have a fairly insurmountable confound: culture. Not just the culture of your parents, but the culture you choose to adopt. Some cultures have value systems which lead to behaviors that inevitably lead to low performance on standardized tests, and in the labor market. The data isn't there, and you can't pretend it is. If you want to compare populations you need experimental control. You need to sample from the populations, and control all development factors and the background context (and you will still have the double blind issue). To do this you need to do it an a desert island, because even middle blacks tend to "inherit" or choose the inner-city culture. The data you have is correlations.
Very in depth article... about kids. Very well written, researched and constructed article... about kids. What you have neglected by sentiment, brevity or nefariousness is the mere fact that kids grow up: emotionally, physically, intellectually, etc., and become adults. Here is an interesting article about that growth: http://www.nytimes.com/2010/08/22/magazine/22Adulthood-t.html?pagewanted=all. I am also quite sure that as a self-stated medical professional you are aware that the brain continues to develop into your early thirties: http://www.jneurosci.org/content/31/30/10937.full.pdf+html?sid=d6a8b5ee-f6ce-4daa-90b8-57d00a5a6fa5, way beyond the years of taking an SAT test.
Since the mollifying effect of continued brain development into the early thirties against youthful SAT scores was not taken into consideration in your article, I am only left to conjecture that the underlying prognosis of your hypothesis that SAT scores are predictors of adult intelligence, much like your hypothesis on the music of your youth being the determining factor of childhood intelligence, although your ebulliently offered evidence on the latter was quite wanting, is that Africans and African-Americans are less-intelligent than other groups and that continues throughout life. And they also have bad music taste.
Although I find your hypothesis more than highly debatable, beginning with the simple fact that a test administered in four hours when you’re 17 is to be somehow indicative of a dynamic lifespan of 78.2 years, what I find most repugnant about your article is your scholarly disingenuousness. You are offering as a representative conclusion for billions of people for thousands of years the findings of a test that was first administered to high-school students in 1926. It is understood that there is a premium on youth in this country, but your global ascription of those who took the SAT to represent intelligence is nothing, if not symptomatic of your desire to cherry pick facts to fit your conclusion. And that cherry-picking is further evidenced by your mischaracterization of rap music sales. Yes, they soared, but not because of your insinuation that only black kids bought it, but because MTV rotated it heavily on its station for ALL kids to buy, which they did, white included. Most perversely, your entire argument is built upon the minds of kids… kids who pose in front of their computer doing stupid things, kids who have no concept of life beyond the walls of their parent’s home, and, probably, most importantly, your desire to prove that the group YOU are associated with is superior to all others.
The world is full of people who failed early only to achieve later and those who achieved early only to falter later.
I know this is an old post, but one comment seemed kind of glib, almost willfully ignorant (but not in an offensive way): Commenter Jeff asserted that Asians in the U.S. are underperforming and do not contribute anything original.
Really? First off, Asians are 4% of the US population, while whites are about 78%, if you account for Hispanic whites. So, right there, you're going to see far more whites among top scientists and inventors, than Asian Americans--even though the latter are actually overrepresented in this group. You can start with the 16 Asian American Nobelists, which is about 1 every 3 years since 1965 when Asians started to immigrate here in large numbers. You've got the 'Father of Fiber Optics', Charles Kao; Magnetic Core memory (the principle behind hard disks) inventor An Wang, founder of Wang Computer (whose contribution to computing is more readily recognized in Europe than America) who's on MIT's Inventors Hall of Fame; Susumu Tonegawa, a Nobelist who cracked the code for antibody development; Lap-chee Tsui, who along with Francis Collins discovered the first genetic cause for a disease; Michio Kaku and Kei Kikkawa, co-inventors of string field theory; several Fields Medalists including Shing Tung Yao of Harvard and Terry Tao of UCLA; JJ Sakurai, the namesake for the American Physical Society's Sakurai Prize, the top prize in theoretical physics; the guy with the most hybrid patents at Ford (can't remember his name, he's Chinese however);Yet-Ming Chiang, the youngest tenured prof in mechanical engineering at MIT who invented a type of lithium ion cell now used in Chrysler and GM hybrids; Feng Hsu, the computer scientist and chief architect for Deep Blue, the first computer to garner a Grandmaster chess rating; Min Kao, the GPS pioneer who founded Garmin in the early 1980s. Those are just a few examples off the top of my head. Add to this the fact that 52% of Silicon Valley firms were founded by Asians--the nature of SV is that companies get started around a key innovation, not marketing or biz connections, so right there that is a pretty good indication of original contributions. Finally, look at any major research university's press releases in science, and many of the top researchers are of Asian descent--for instance, Stanford frequently reports on major computing advanced and many of these are Chinese scientists.
What is striking about Jeff's comment is that it reflects that he basically buys what he hears in the media. Thing is, the mainstream media overlooks Asians, partly due to bias and partly because Asians (to further a stereotype) do not put themselves forward. The media is notorious for being superficial so it's not going to dig deep, and in science that's important because it's often hard to figure out where and from whom an idea originated. And it's probably harder to speak to a foreign-born Asian so they'll just go to the white guy to facilitate things. A recent example: on PBS a reporter recently interviewed Alan Guth, a top particle physicist, and he mentioned a Chinese scientist at Cornell whom he credited with the original idea in the 80s. The reporter did not seem interested, and there was no effort to speak to that scientist.
Forgot to mention Madame Wu, who had the privilege of being the only physicist other than Madame Curie to be dubbed 'Madame'. Many believe she should have won a Nobel Prize. It is probable that many an Asian did not get recommended for a prize because they did not promote themselve--not to say that those who garner awards are self-promoters, but in a sea of researcher who all may claim key credit for a discovery, often the loudest or most affable investigator gets the nod. Science may be quantitative, after all, but science has politics like every field and politics is not quantitative or precise.
So, we should believe that the LSAT and USMLE Step 1 count as true "performance," but not the ACT, SAT, and MCAT? Please. The truth is that hospitals are letting nurse practitioners who don't take the USMLE do the work of physicians because there is a doctor shortage, and evidence shows that nothing is lost.
Did you not read all the data there? East Asians (along with Blacks and Hispanics and other muds) are genetically INFERIOR to Whites. Deal with it.
(And yes doing well on the Bar Exam and the Medical Licensing Exam is more important than doing well on the LSAT or MCAT. Duh.)
"Although the above studies have found that Asian Americans have higher grades in elementary, middle, and high school, this is not necessarily the case in college. Data on performance in college has been based on nationally-representative data sets such as the High School and Beyond Study and the Beginning Postsecondary Students Longitudinal Study. It also includes data from an entire cohort of entering freshman at specific universities, such as University of California, Berkeley and also Los Angeles, and also from the entire University of California system.
Grades
Sue and Abe (1988) reported on the high school grade-point averages, scores on the Scholastic Aptitude Tests (SAT) and the College Board Achievement Tests, and the GPAs in freshman year of all Asian American and white students who enrolled in the eight University of California campuses in 1984. Asian Americans had higher high school GPAs, but similar GPAs in their first year of college (i.e., Asian Americans 2.74, and whites 2.72). Other studies also report similar college GPAs for Asian Americans and whites, but higher college GPAs for Asian Americans compared to ethnic minority groups (Castro & Rice, 2003; Tan, 1994).
However, studies focused specifically on students attending the University of California, Berkeley, have reported lower college GPAs for Asian Americans compared to Whites (Thomson, 1998; Ying et al., 2001). Ying et al. reports for all students enrolled in spring 1995, Whites had higher mean GPAs (3.18) than Asian Americans (3.05) who had higher GPAs than Hispanics (2.86) and African Americans (2.71).
Additional studies have also reported lower college GPAs for Asian Americans than Whites or non-Asians (Toupin & Son, 1991; Tseng, 2000). A study by Toupin and Son of all Asian American students who attended a small, private, highly selective university in the Northeast in 1984, 1985, and 1986 in the College of Arts and Science found that Asian Americans had lower GPAs than non-Asians (matched on socio-economic background and SAT scores). They also were more likely to be placed on academic probation, and less likely to appear on the Dean’s List at least one time. A report by Tseng (2000), based on a sub-sample of 1,200 entering students at New York University in 1996 and 1998, also found that Whites had higher college GPAs than Asian Americans.
Tseng (2000) points out that these lower college GPAs among Asian Americans may be due to their being disproportionately enrolled in math and science courses, where on average, students receive lower grades than in other courses. Studies do find that a greater proportion of Asian American students are math/science majors or enroll in math and science courses than other ethnic groups (Ahn Toupin & Son, 1991; Tan, 1994; Tseng, 2000; Xie & Goyette, 2003). However, Tseng found that differences in GPAs between Asian and White students remained when controlling for course of study. Thus, the lower GPAs of Asian students at NYU were not due to their course of study. Tseng found that differences in GPA were somewhat explained by their experiences with prejudice and discrimination."
- Asian American Handbook of Psychology
"Even Asian students, long believed by some to be academic superstars, end up graduating with a class rank that is on average 10 percentage points below the class rank of similar Whites…
It is not clear what contributes to underperformance by Asian students. Some of the standard explanations advanced for Blacks do not seem to apply to Asians."
Thomas Espenshade, No Longer Separate, Not Yet Equal (2009, p. 251-252
"Results are presented in Table 6. The first columns just controls for race and gender. Here we see that males and Asians lose ground during their time at Duke relative to their female and non-Asian counterparts. This result continues as more controls are added."
Peter Arcidiacono, et al. "What happens after enrollment? An analysis of the time path of racial differences in GPA and major choice" 2012
"Proportionately more blacks and Hispanics were on academic probation at some point during their enrollment at UM. A greater percentage of Asians was on academic probation compared to whites...
Comparing Asian and white admittees at the same percentiles, Asian GPAs were either the same or lower than white GPAs. In 2004, for instance, Asian GPAs at the 75th percentile were lower than those for whites at the same percentile, while scores at the other percentiles were the same. In 2005, the Asian median was lower than the median for white admittees, as was the Asian GPA at the 75th percentile....
The college GPAs for Asians were lower than those for whites at the same percentile for every year. For the class entering in 1999, the median GPA for Asians was 3.0, which was the same as the GPA for whites at the 25th percentile. That is, half the Asian enrollees had lower college grades compared to 75 percent of white enrollees. Asian GPAs at the 75th percentile fell between white GPAs at the 50th and 75th percentiles. For the entering class of 2003, the Asian GPA at the 75th percentile was the same as the white median, while the Asian median fell between the 25th and 50th percentile for whites. For 2004, Asian GPAs at the 25th, 50th, and 75th percentiles are all slightly lower than GPAs for whites at the same percentiles."
- Althea K. Nagai, "Racial and Ethnic Preferences in Undergraduate Admissions at the University of Michigan" 2006
"Although White students on average scored highest, followed by Asian Americans, Hispanics, and African Americans, these gaps become narrower after controlling for MCAT scores and undergraduate GPAs. One might expect Asian Americans, who as a group have had the highest mean MCAT scores, to outperform other racial groups during medical school. However, two major studies across time and across medical schools have reported lower mean performance for Asian Americans than for White students in medical school."
- Jon Veloski et al. "Prediction of Students’ Performances on Licensing Examinations Using Age, Race, Sex, Undergraduate GPAs, and MCAT scores" 2000
Bar Exam passage rates for CA:
"Whites: 74.7%
Asians: 63.6%
Hispanics: 57.4%
Blacks: 44.4%
Among repeat test takers, the same order holds:
Whites: 21.1%
Asians: 16.7%
Hispanics: 15.9%
Blacks: 10.4%"
"But despite their seeming success at integrating into corporate cultures, Asians are, in fact, failing in one key factor: They haven’t been able to break through the “bamboo ceiling.” Asians are woefully underrepresented in top leadership positions at U.S. companies. They constitute 5 percent of the U.S. population, yet only 1.5 percent of Fortune 500 CEOs are Asian. Prevented from reaching their full potential in the workplace, CWLP research finds, Asian men are more than three times as likely as Caucasians to have one foot out the door and are looking to quit in the next year, and Asian women are 40 percent more likely to plan to quit within the year."
"White students were more likely to have obtained first-class or upper second-class honours than were students from ethnic minorities. In particular, Connor et al. pointed out that only a third of Black students had gained first-class or upper second-class honours, compared with about 45% of Indian and Chinese students and about 60% of White students."
- John T.E. Richardson, "The attainment of ethnic minority students in UK higher education" 2008
"But while the numbers of Chinese students attending UK universities is a success story, new research shows that where their academic attainment is concerned, the picture is not so good. While nearly 68% of all students – and 52% of overseas students from outside the European Union – graduated with a first or 2.1 last year, this was true of only 42% of students from China, according to the latest figures from the Higher Education Statistics Agency (Hesa).
This undermines the traditional stereotype of the hard-working, high-achieving Chinese student. “There is all this talk – almost propaganda – about how brilliant the Chinese education system is, so when they come to the UK you would expect them to do really well,” says Zhiqi Wang, senior lecturer in accounting and finance at Bath Spa University and one of the authors of the new research. Wang says the reason for Chinese students’ low academic attainment is unknown. “We could clearly see the poor performance of Chinese students at UK universities but we had no idea why it was.” So to find an explanation, Wang and Ian Crawford, a teaching fellow in accounting and finance at the University of Bath, decided to compare the performance of Chinese and British undergraduates in each year of their degree. Taking a sample of just over 100 British and Chinese accounting and finance first-degree students who enrolled in 2008, and comparing their average marks and final degree classification, they found a dramatic drop in performance among the Chinese students between year one, when they performed better than their UK counterparts, and year two, when they performed worse. This did not seem to be explained by their previous academic qualifications.
Crawford and Wang believe the slump in attainment can be put down to two factors. First, Chinese students fail to adapt their approaches to learning and so their performance declines in the later years of a degree when the complexity of the work increases. And, second, while the UK and Chinese education systems are not that different, the strong focus in China on study and achieving qualifications means many young people enroll in higher education due to pressure from family or the jobs market rather than their own motivation.
According to Cristina Iannelli, professor of education and social stratification at the University of Edinburgh, part of the problem may be the changing socio-economic background of Chinese undergraduates. Using figures from the Hesa, Ianelli found that while 85% of Chinese undergraduates at British universities in 2000 and 2001 were mature students, often funded by the Chinese government, since 2004, they have have been younger, more likely to be women, funded by their families and therefore more in need of support. "We accept all these students but we don't know much about them," says Ianelli. "I see some of them struggling because they really don't know before coming here exactly what is expected of them." She says it can be difficult to measure how well they are prepared academically because it is hard to benchmark the qualifications they have against A-levels. "Are we just opening up our universities and we don't care what their prior attainment is, or are we actually comparing qualifications across international education systems?" she asks. "We may be accepting students who aren't as good as they should be. Or it could be language, or experiencing a different culture.""
Data found here:
http://mpcdot.com/forums/topic/4163-plagiarized-effortpost-on-studyasians/#entry182899
Even Steve Hsu was unable to adequately rebut all the charges and had to resort to the typical feeble excuses of racism, discrimination, stereotype threat, personality differences (equal but different winkwink) etc. to explain Asian underperformance at the higher levels. Just like the excuses made for women and other minorities.
Hsu's words:
"I think it is possible that Asian "strength of application" overpredicts later career success*. There could be many reasons for this. For example, it could be that Asian hard work boosts test taking results and grades more than it does real world achievement. It could also be that tests and grades are fair, whereas Asians face a certain amount of race-related disadvantage later in their careers -- e.g., unconscious bias, lack of "ethnic affinity" networks, etc. (If you talk to highly trained Chinese scientists and businesspeople returning to China from the US, most will describe an uphill struggle for Asians in the US; this contrasts with glib statements from white Americans about how little anti-Asian bias there is in elite careers). Finally, Asians may have lower rates of sociopathy, which reduces their chances of making it to the top (close inspection suggests it is mostly sociopaths at the top ;-)"
http://infoproc.blogspot.com/2011/12/asian-admissions-statistical-prediction.html
White supremacy and racial consciousness might make pansies like you uncomfortable, but that doesn't make them any less right and true.
Whites built the modern world. Whites dominate the modern world. Non-Whites have no business in White nations.
Asians and whites have both made important contributions to modern civilization. Chinese people gave the world ink, paper, and, most importantly, ping-pong. Whites gave the world political correctness, which might undo civilization.
Controlling for SAT score but not college major means that you are proving that Asians score well on the SAT because they're smart and major in difficult, useful fields of study because they're smart.
I have taken the MCAT and USMLE. Count me as a critic of USMLE, which tests obscure medical knowledge that most fields of medicine don't need in a very time-intensive format at a time when future doctors are thinking about specialization. The MCAT tests more general science knowledge well before specialization.
The SAT results are very easy to explain looking at the fertility rate, infant mortality rate...correlates at like r=-.8 to r=-.9 how come no one mentions those variables even though the SAT scores only reflect the age 16-18 group which for Whites and East Asians is basically no one meaning higher average scores are more likely (Whites and East Asians have a median age in the 40s or so the younger group is proportionally very small with small sample sizes outliers like talented students stand out and it's automatically easier to gain higher average scores).
Basically any group can gain high average SAT scores if they can gain fertility rates, infant mortality rates as low as Whites and East Asians.
The fertility rate is directly connected to the younger group sample.
The infant mortality rate is directly connected to brain development at early ages.
It's such a simple easy connection and matches nearly perfectly to all of the data.
But you don't need high average SAT scores for survival the very low fertility rates among Whites and East Asians is already turning into a negative thing causing population decline and economic issues.
Post a Comment