Friday, December 2, 2011

Blacks with Bullets Embedded in Bone


nce upon a time, a people now known as African Americans left plantations of slavery to live in relative peace among white people. Unfortunately, the mean, villainous whites schemed systems of organized crime that allowed them to enrich themselves into tranquil opulence, while they excluded the African Americans from their illegal get-rich connivances. Amidst their impoverishment, the African Americans experienced a psychological transformation that forced many of them to become violent criminals. The End.

This story emerges from the works cited by Steven Pinker in his bestselling, and possibly Pulitzer Prize-winning book, The Better Angels of Our Nature. Pinker writes,

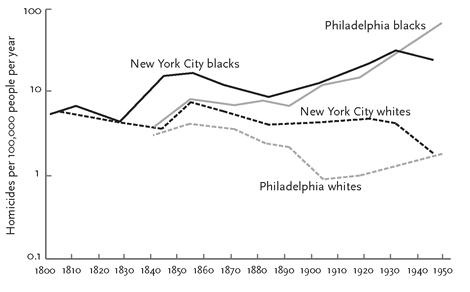
Figure 3-14 shows the rates for two cities in which black-on-black and white-on-white homicides can be distinguished. The graph reveals that the racial disparity in American homicide has not always been with us.


Here is the figure:


He cites Eric Monkkonen’s Murder in New York City, which says,

Essentially, crime was more profitable for whites, whereas even in crime, discrimination blocked the more lucrative opportunities for African Americans and encouraged more violent, destructive offenses.


Pinker’s characterization of homicide data is another example of his distortions on matters pertaining to race and violence. See my previous post on how Pinker flubbed his summary of the decades of research on the best understood violence gene, including his citation of a copy-and-paste error. Much of his data for New York City in the above graph, including all years of equal homicide rates, comes from American History by Randolph Roth, who plotted a similar graph shown below and made clear that the data plotted actually do not represent known intraracial homicide assailants, but just homicide victims.


In fact, Roth further qualified the data for Philadelphia:


It may prove that blacks accounted for a greater proportion of homicide perpetrators than victims in Philadelphia, but determining that will require more data, including a tally of blacks and whites killed in riots. Blacks committed homicide there at over twice the rate whites did, 1839-1846, according to indictment records (6.5 per 100,000 adults per year versus 2.7), because they were more likely to commit both intraracial and interracial homicide. It may be that Philadelphia’s antiblack riots, the disfranchisement of blacks in Pennsylvania, and increased competition with whites for unskilled jobs were beginning to take their toll.


Roger Lane also questioned Philadelphia’s homicide victimhood data because coroners’ records “proved unreliable.” Coroners frequently failed to indicate that a death was a homicide. Ted Robert Gurr thought this problem might exist in other American cities of that era, but no one had bothered to check as Lane had done in Philadelphia.

Roth did provide actual estimates of New York City homicides, which doubled the very small racial gap in victimization. For Philadelphia, Pinker was not clear whether and for what years he made use of Roth’s data. Roth estimated that, from 1839 to 1846, Philadelphia’s African-American rate of homicide victimization was 28 percent higher than that of whites.

Monkkonen provided some context for the period of purported New York City homicide racial equality. First, he advised caution about the quality of the data. “Even though we can outline this demographic history of black New Yorkers, we cannot yet establish precise population measures… Thus, any construction of rates with at-risk denominators must be understood as estimates.” How unfortunate that this important historic moment of violence equality was so poorly documented.

Generalizing New York City to the rest of America has other complicating factors. Monkkonen offered estimates that suggest that racial homicide equality resulted from enormous white ethnic inequality. “My best estimate for the decade centered on 1860,” he wrote, “sets the Irish homicide rate at 37.5 per 100,000 adult males, the German rate at 15.7, and the black rate at 32.” About half of New York City’s population was immigrant in 1860. It is ironic that Pinker is allowing the violent tendencies of New York Irish-American immigrants to characterize the behavior of American whites in general because English Americans took to calling them “white Negroes.”

Lastly, the age demographics of these groups differed. In 1850, Irish immigrant males in New York City were 19 percent more likely to be in the potentially more violent age range of 16 to 45 than African-American men, and, despite being half as homicidal, German immigrant men were 73 percent more likely than African-American men to be in that age range. Monkkonen does not entirely attribute the eventual growth of a large racial homicide gap to poverty because New York City experienced a massive growth of young black men, such that in 1940 only 19 percent of African-American New York City men in this age range were born there.

Another recently published study, which Pinker did not consider, about this period described a qualitative distinction of racial patterns of violence. Last year, Carlina de la Cova published the first large-scale analysis of its kind, reviewing 651 male cadavers “of low socioeconomic status born between 1825 and 1877” from Cleveland, St. Louis, and Washington DC. Though these remains are apparently not of homicide victims, they do offer evidence of racial differences in violence from that era, but only among the poor, as none owned property, and most were transient. Thus, the study should bias towards exaggerating white delinquency with a sample more unrepresentative of whites than African Americans.

Although fully 92 percent of all cadavers had skeletal fractures, in every category of fracture, whites had more. The smallest differences were for injuries that were most plausibly from serious fights. 50 percent of whites had cranial fractures, compared to 48 percent of African Americans. 44.8 percent of whites had nasal fractures, compared to 42.3 percent of African Americans. Differences for vertebrae fracture rates were much greater, at 72.7 percent for whites and 35.8 percent for African Americans. De la Cova considered osteoporosis as a possible explanation. She noted that African Americans have less osteoporosis, greater bone mass, denser cortical bone, and lower bone resorption. Indeed, black people have greater bone mineral density from infancy, and hormonal levels contribute to such racial differences, even in childhood,. (Recall that the media accused research oncologist Kathy Albain of “racial medical profiling” for discovering that racial disparities in cancer mortality remain only in cancers related to sex hormones after accounting for zip code.) Of course, skin color affects the pathways of the hormone vitamin D. De la Cova checked for an influence of osteoporosis and age of death, but that negative result does not negate the fact that black people have stronger bones even in comparisons of whites and blacks without osteoporosis. This seems to extend to tooth loss, which de la Cova also utilized in her attempt to support differing rates of fighting. Even in the present-era National Health and Nutrition Examination Survey-III, in which whites were better educated, white people still had a higher rate of tooth loss than African Americans and Mexican Americans. In fact, having less education was significantly associated with tooth loss in white people, but not African Americans and Mexican Americans.

Even so, de la Cova points to historical accounts of popular and “ritualized” pugilism among poor white men to settle disputes and protect their “honor,” which logically might play less of a role in the violent behavior of a systematically oppressed minority.

On the other hand, black men comprised all eight of the gunshot wounds, most having a bullet embedded in a bone. Though this was a small number of the cadavers, historical accounts and African-American newspaper advertisements also reflected a gun-oriented African-American culture. Perhaps their early association with guns made fistfights an untenable means of resolving conflicts.

The US Census Bureau did not start tracking crime until 1880, and despite being a minority, African Americans were receiving 54 percent of unlawfully concealed weapons charges and 75 percent of exhibiting a deadly weapon charges and were committing 83 percent of shootings, 85 percent of stabbings, 48 percent of manslaughter homicides, and 43 percent of murders.

Perhaps the best argument for an era of relative homicide equality would be the well-documented, enormous widening of the racial homicide gap in the years that followed. Gurr provided an illustrative graph of this for Washington DC.


Here is Jeffrey Adler’s homicide graph for Chicago when African Americans were a tiny minority of the population.


Societal changes can influence patterns of violence, and these years certainly qualified as profoundly transformative for African Americans. However, given that African Americans have higher allele frequencies than whites of all or (debatably) nearly all identified violence genes, anyone who advertises a distant past of black peaceableness deserves an inspection of their data. I suggest this should even be so for a beloved Harvard celebrity professor.


ResearchBlogging.org


Adler, Jeffrey S. 2006. First in Violence, Deepest in Dirt: Homicide in Chicago, 1875-1920. Cambridge, Mass.: Harvard University Press.

De La Cova C (2010). Cultural patterns of trauma among 19th-century-born males in cadaver collections. American Anthropologist, 112 (4), 589-606 PMID: 21132946

Gurr, T. (1981). Historical Trends in Violent Crime: A Critical Review of the Evidence Crime and Justice, 3 DOI: 10.1086/449082

Hui SL, Dimeglio LA, Longcope C, Peacock M, McClintock R, Perkins AJ, & Johnston CC Jr (2003). Difference in bone mass between black and white American children: attributable to body build, sex hormone levels, or bone turnover? The Journal of clinical endocrinology and metabolism, 88 (2), 642-9 PMID: 12574194

Jimenez M, Dietrich T, Shih MC, Li Y, & Joshipura KJ (2009). Racial/ethnic variations in associations between socioeconomic factors and tooth loss. Community dentistry and oral epidemiology, 37 (3), 267-75 PMID: 19302573

Lane, Roger. 1979. Violent Death in the City: Suicide, Accident, and Murder in Nineteenth-Century Philadelphia. Cambridge, Mass.: Harvard University Press.

Monkkonen, Eric H. 2001. Murder in New York City. Berkeley: University of California Press.

Pinker, Steven. 2011. The Better Angels of Our Nature: Why Violence Has Declined. New York, New York: Viking Penguin.

Roth, Randolph. 2009. American Homicide. Cambridge, Mass.: Harvard University Press.

Monday, October 24, 2011

The Education Bubble

Occupy Wall Street protests are drawing more attention to the Education Bubble. Since I coined the phrase, “Education Bubble,” I thought that I should repost my YouTube video about it. I originally posted this on May 4th, 2006, two years before Charles Murray published Real Education and three years before articles about the bubble began appearing in mainstream publications like The Chronicle of Higher Education and The Economist. Wikipedia claims that Bill Bennett originated the concept, but his editorial in 1987 did not use the phrase, and, of course, could not relate it to the series of economic bubbles that have occurred since.


The idea has really caught fire recently. PayPal founder Peter Thiel created a grant to encourage young people to skip college and start a business. He joined Murray in an Intelligence Squared debate on the subject. On Friday, comedian Bill Maher endorsed the existence of an education bubble on his HBO program, which elicited the typical, kneejerk reaction from liberal columnist Thomas Friedman to pump more money into educating more students. Friedman wants another GI Bill, but we did have a Post-9/11 GI Bill.

In order for credentials to have solid value, they must be a precious resource (to the extent that educational benefit bolsters zero-sum competitiveness), represent value added, and represent a quality of enduring merit. Because one often associates education with intelligence, and IQ tends to hold a stable value throughout an individual’s adulthood, one way to strengthen education’s value would be to make it more closely approximate IQ through stiffer admission policies or more challenging coursework. This also begs the question of whether allowing IQ testing in hiring would not be more efficient and, thereby, allow education to fill a different niche. Columnists like Friedman like to emphasize the role of education in teaching skills, but many skills do not necessarily endure as IQ and perhaps perseverance can. After the dot-com bubble burst and many engineers and computer scientists lost jobs, I recall James Fallows suggesting that graduates be able to purchase skills insurance so that their heavy investment does not crash when their particular set of specialized skills becomes obsolete. Maher quotes Fareed Zakaria in repeating the clichéd complaint about America’s paucity of engineers, but why should young people invest in advanced high-technology skills when someone as experienced and intelligent as Warren Buffett does not even feel confident in betting some money in high-technology companies. Even if the modern “information age” economy demands a more educated populace, there is no other age in which everyday folks had more access to cheap or free knowledge without needing to earn college credits in the process. Books are now available via illegal downloads as music has been for years, and bookstores are closing down permanently. Higher education is too expensive to constantly retrain workers, but tests could inexpensively verify knowledge or abilities.

What I find most ironic about the Education Bubble is that a liberal like Maher would endorse it without seeing that nearly any implication of it endorses politically incorrect concepts like IQ and the limitations of the well-meaning societal intervention that higher education is. All of this discussion is a high-wire act over the issue of race. It might not be “nice” to talk about race honestly, but racial disparities in IQ, SAT scores, and college majors are constants with profound economic impacts. Any reform will stir racial controversies with new disparities. Businesses cannot use straight IQ tests for reasons of race, alone. Can we afford our racial consensus?

Thursday, October 13, 2011

Kill Popular Science

submit to reddit

Steven Pinker’s new book, “The Better Angels of Our Nature,” is out, and the reception reminds me of an album release from a trendy band during the 1990’s. I must beg my readers’ forgiveness for writing this very preliminary review for a book that I have not finished because the subject matter is so important. Most reviews and buzz for this book center on Pinker’s observations about the decline of violence and the advance of enlightened views. Pinker has been speaking about this phenomenon for years, and many facets of it are apparent in my own lifetime, such as the utter metamorphosis of public consensus regarding homosexuality. The book has a number of fascinating graphs that speak to the changes, and I have little reason to critique his central thesis, other than to say that I am not sure the trend entirely represents genuine progress. For example, I suspect that he could have placed a graph of the decline of fat jokes alongside his graphs of the decline of racial prejudices. While society has improved control over physical aggression, the obesity epidemic proves that indiscipline still finds expression. In fact, when one considers the growing acceptance of “alternative”—excuse me, “integrative” medicine, one can see how the triumph of enlightened tolerance can coincide with a lax shrug off of reason and scientific rigor.

Though I perused the tome in the modern cursory version of the word’s contradictory meanings, I gave special attention to the latter chapters, particularly chapters 8 and 9 on the nature of violence, itself, which has been one of my obsessions. That discussion concerns the overriding paradox of this work. How could this man, who wrote The Blank Slate to passionately declare that we are not and that behavior is part heredity, reconcile with a belief that societal evolution pushed radical behavioral modification? I regret to say that this was a serious weakness of an otherwise well-reasoned exposition.

First let me stress that I do not see Pinker’s observations as fundamentally opposed to the revolution taking place in biosocial criminology and genetic psychiatry. On the contrary, making aggression anomalous likely accentuates the role of genetics and biology in what deserves to be considered a veritable behavioral disease. What science really calls into question is whether historic trends justify extrapolation, and from what I can tell, Pinker has dodged such speculation. To illustrate his handling, the book contains extensive discussion of how the secular rise in IQ, known as the Flynn effect, could be reducing violence, but I found no mention of the evidence for subsequent plateauing. Then again, my hope is that the research on the genetics of violence, which I attempt to elucidate, could help channel efforts to find new ways, including pharmacological developments, to sustain aggression’s decline.

Judging by Pinker’s treatment of the subject, my message is not getting out. He dismissed research on monoamine oxidase A (MAOA) using a study with which my regular readers are all too familiar.

[A]n association between the gene and aggression has not been found in non-European populations, perhaps because they have evolved other ways of regulating their catecholamine levels. (Genes often act in networks regulated by feedback loops, so in populations in which a particular gene is less effective, other genes may step up their activity to compensate.) For now, the Warrior Gene theory is staggering around with possibly fatal wounds.


Nice try. Pinker is referencing the Widom and Brzustowicz paper that combined men and women to compare “whites” to “non-whites.” Gender was not controlled, and that white sample was 33% female. Non-whites were 38% female, but women were far more represented among non-white subjects with the low-activity, 3-repeat allele. For the subjects with the 3-repeat allele, which is the allele considered most impacted by the environmental trigger, whites were 24% female, and non-whites were 43% female. Antisocial behavior in women, but not men, is mediated by the epigenetic methylation of MAOA as well as a newly discovered second promoter that actually has more effect in women than the alleles mentioned. Also, of course, MAOA is located on the X chromosome. Women have two copies, which helps explain why even the radical Brunner-syndrome mutation that completely disables the gene does not seem to affect the behavior of women. It can be nice to have a spare.

Pinker seems to have received his introduction to this subject through the New Zealand Maori controversy, in which Rod Lea had to make amends for allegedly saying that the Maori are prone to criminality. Thus, Pinker is completely unaware that studies have found that MAOA influences aggression in non-whites. Weder et al found that the gene-environment association of MAOA and aggression held for a 58-subject sample of African-American and biracial children. Kevin Beaver’s research also helps support this association. His 2009 study on MAOA’s effect on gang membership and weapon use included African Americans. His 2010 study on African-American men and violence used a genetic index that included MAOA and four other genes that affect catecholamine levels.

At least claiming that MAOA does not affect non-white people fits a politically correct agenda of raising the self-esteem of minorities who feel the burden of a violent stereotype. What would you think of Steven Pinker if he spread a complete falsehood that could label a group of people genetically violent without any scientific basis whatsoever?

[T]he low-activity version of the gene is even more common in Chinese men (77 percent of whom carry it), and the Chinese are neither descended from warriors in their recent history nor particularly prone to social pathology in modern societies.


I previously debunked this, but I guess I must do so, again. A study by Lu et al found that 42 Taiwanese men, or 55% of their 77-subject control sample, had the 3-repeat allele of MAOA. Lea and Chambers copied the information incorrectly. Then, an editorial against MAOA research by a doctoral student repeated the falsehood. Now, Pinker has immortalized this slander against Chinese people in a bestselling book. The actual allele frequency given by Lu et al matches the allele frequency found for Asians in subsequent research, which is not higher than that of other groups besides white people. Pinker, like so many others, conflated the 3-repeat allele with the 2-repeat allele as the “low-activity allele,” even though the 2-repeat allele doubles the association with violence without needing an environmental trigger. The 2-repeat allele accounts for 4.7% of African-American MAOA genes and 0.00067% of Asian MAOA genes (assuming that the only Chinese control subject with the allele did not have mixed ancestry). Not only does this bogus insult create a new stereotype for Chinese people, but the numbers error reinforces an old generalization, as all four guilty parties were white boys. (Chinese people, when you buy my neighborhood, recall that I personally sent Pinker a corrigendum request.)


Herein lies the problem with popular science. Steven Pinker is a Harvard professor who previously chastised Malcolm Gladwell for misspelling “igon value.” Pinker’s new book encompasses a prodigious collection of disparate lines of evidence. Even so, he dismissed a vital segment of potentially life-saving research using biased sources that were motivated at least in one case by racial politics. When Dr. Phil stumbled through his television show episode on the warrior gene, he made mistakes and showed his ignorance, but he did not bring an entire field of study into disrepute. However, when Malcolm Gladwell or Stephen Jay Gould call IQ testing an “ice flow” or decry its “reification,” it has consequences for science. Gladwell and Pinker inhabit a pantheon of respected liberal thinkers whose influence reverberates throughout academia. Their stature alone can transform an ignorant statement into an authoritative observation. Their superficial summations can leave a lasting imprint on another’s life’s work, as they bring along a vast audience of comparative ignoramuses to boo rogue points of view (not unlike a daytime talk show).


ResearchBlogging.org


Widom CS, & Brzustowicz LM (2006). MAOA and the "cycle of violence:" childhood abuse and neglect, MAOA genotype, and risk for violent and antisocial behavior. Biological psychiatry, 60 (7), 684-9 PMID: 16814261

Weder N, Yang BZ, Douglas-Palumberi H, Massey J, Krystal JH, Gelernter J, & Kaufman J (2009). MAOA genotype, maltreatment, and aggressive behavior: the changing impact of genotype at varying levels of trauma. Biological psychiatry, 65 (5), 417-24 PMID: 18996506

Beaver KM, DeLisi M, Vaughn MG, & Barnes JC (2010). Monoamine oxidase A genotype is associated with gang membership and weapon use. Comprehensive psychiatry, 51 (2), 130-4 PMID: 20152292

Kevin Beaver, Ashley Sak, Jamie Vaske, & Jessica Nilsson (2010). Genetic risk, parent–child relations, and antisocial phenotypes in a sample of African-American males Psychiatry Research, 175 (1-2), 160-164

Lu RB, Lee JF, Ko HC, Lin WW, Chen K, & Shih JC (2002). No association of the MAOA gene with alcoholism among Han Chinese males in Taiwan. Progress in neuro-psychopharmacology & biological psychiatry, 26 (3), 457-61 PMID: 11999895

Lea R, & Chambers G (2007). Monoamine oxidase, addiction, and the "warrior" gene hypothesis. The New Zealand medical journal, 120 (1250) PMID: 17339897

Patrick-Michael Whittle (2009). Darwinism and the nature of Māori MAI Review

Philibert RA, Gunter TD, Beach SR, Brody GH, & Madan A (2008). MAOA methylation is associated with nicotine and alcohol dependence in women. American journal of medical genetics. Part B, Neuropsychiatric genetics : the official publication of the International Society of Psychiatric Genetics, 147B (5), 565-70 PMID: 18454435

Philibert RA, Wernett P, Plume J, Packer H, Brody GH, & Beach SR (2011). Gene environment interactions with a novel variable Monoamine Oxidase A transcriptional enhancer are associated with antisocial personality disorder. Biological psychology, 87 (3), 366-71 PMID: 21554924

Sunday, October 9, 2011

Girls Versus Boys: The Final Battle

submit to reddit

SAT data provide an exciting reservoir of information thanks to extremely large sample sizes with detailed demographic data over a number of years. I previously graphed SAT scores by race and showed that the score gap between White people and African Americans greatly narrowed until the early 1990’s and that Asian Americans have been improving their SAT scores, unlike other groups. Now, I shall present how men and women compare for each racial group.


In 1966, William Petersen coined the phrase “model minority” to recognize the accomplishments of Japanese Americans. Liberals revised the label to “model minority myth,” which imparts elements of bitter sneering and jealousy, but the original compliment has never been truer for the SAT results of Asian Americans. Asian-American women appear to be advancing even faster than their male counterparts. Recent years have brought declines in the standard deviation gaps between Asian-American men and women on the math and critical reading (formerly “verbal”) sub-tests.

May all the trees that died for treatises on the eroticization of Asian women and the emasculation of Asian men rest in peace. With that said, I shall add my Asian Female Fit Hypothesis: Asian women are able to progress faster than other demographic categories because they transcend gender roles and expectations, in contrast with White women.

Though White women did slightly improve last year on the math SAT sub-test relative to White men, that was mostly due to a slight drop in the male score. Numerous factors could be discouraging academic progress for White women, particularly in math and the hard sciences. White women, as a group, might not place as high a priority on accomplishment in mathematics. Perhaps they see math as leading to career tracks that are less enjoyable or that would earn an income that would intimidate male suitors. Perhaps they associate math with demanding but financially rewarding careers, and some of them feel that only men should have to fill such a demanding provider role. Advanced math coursework and preparation could have a culture that is unappealing to White women. Also, a common view argues that women feel displaying intelligence makes them less attractive to men. For both young men and women, distractions can hurt academic performance, but perhaps White women are more preoccupied by them than White men.

I suggest that Asian-American women are able to transcend such barriers better than White women. Asians, in general, have a higher average IQ and tend to perform especially well on the SAT math sub-test. This advantage could give Asian women a confidence with mathematics above some threshold that makes further study more enjoyable and less intimidating. Another commonly held view is that Asian women are more amenable, perhaps owing to Confucian values, to relationships with studious men with whom they would come more in contact. I think that men actually do appreciate intelligent women, and the cultures of professions steeped in mathematics, like engineering, are so lacking in female representation that Asian women on such professional paths might be finding a comfortable niche. I also propose that Asian women have the advantage of simple beauty.

At first, one might think that physical attractiveness has nothing to do with mathematics skill, but beauty and fashion have a profound effect on the self-esteem of young women and can become a demanding preoccupation. Many Asian women have a simple beauty that does not really require makeup or hair treatments in modern American culture. Most Asian women whom I have known also seem to be naturally thin without exercising. A recent large meta-analysis of genome-wide association studies found three important loci for body fat percentage. According to the HapMap database, two of the alleles associated with increased body fat are far more common in White and Black people than in Chinese and Japanese people. The third allele is somewhat more common in Japanese and Chinese people, but the study found that this allele was associated with body fat percentage in Europeans, not in people from Northern India.

Allele Frequencies of loci that increase body fat percentage:

FTO:
White – 46.0%
Chinese – 13.9%
Japanese – 18.6%
African-American – 46.5%
Nigerian Yoruban – 45.2%
Mexican-American – 20.7%
Gujarati Indian – 25.2%

IRS1:
White – 41.8%
Chinese – 10.0%
Japanese – 6.8%
Nigerian Yoruban – 64.3%

SPRY2 (increased body fat percentage in Europeans, not Northern Indians):
White – 27.7%
Chinese – 48.1%
Japanese – 45.0%
African-American – 14.0%
Nigerian Yoruban – 18.4%
Mexican-American – 35.3%
Gujarati Indian – 48.5%

African-American women also are closing their gap with African-American men on the SAT math sub-test, but scores for Black people, as a whole, are declining, and the gap with White people seems to be slightly widening, as I previously discussed. Still, African-American women are the only demographic to consistently outperform their male counterparts on the SAT critical reading sub-test. On the newer writing sub-test, all demographics have a female advantage, but African Americans have the largest gender gap, and it is growing. Ever since the writing sub-test began in 2006, African-American women have had a consistent total raw score advantage over African-American men, and they are the only group of women to ever do so. Although it might be declining, the Hispanic male advantage over Hispanic women lies at the other end of the spectrum.


In conclusion, whether you are a dumb blonde, a dragon lady who is good at math, a troubled Black man, or a macho Mexican, the SAT reinforces the offensive stereotype that is right for you.

ResearchBlogging.org


Kilpeläinen TO, Zillikens MC, Stančákova A, Finucane FM, Ried JS, Langenberg C, Zhang W, Beckmann JS, Luan J, Vandenput L, Styrkarsdottir U, Zhou Y, Smith AV, Zhao JH, Amin N, Vedantam S, Shin SY, Haritunians T, Fu M, Feitosa MF, Kumari M, Halldorsson BV, Tikkanen E, Mangino M, Hayward C, Song C, Arnold AM, Aulchenko YS, Oostra BA, Campbell H, Cupples LA, Davis KE, Döring A, Eiriksdottir G, Estrada K, Fernández-Real JM, Garcia M, Gieger C, Glazer NL, Guiducci C, Hofman A, Humphries SE, Isomaa B, Jacobs LC, Jula A, Karasik D, Karlsson MK, Khaw KT, Kim LJ, Kivimäki M, Klopp N, Kühnel B, Kuusisto J, Liu Y, Ljunggren O, Lorentzon M, Luben RN, McKnight B, Mellström D, Mitchell BD, Mooser V, Moreno JM, Männistö S, O'Connell JR, Pascoe L, Peltonen L, Peral B, Perola M, Psaty BM, Salomaa V, Savage DB, Semple RK, Skaric-Juric T, Sigurdsson G, Song KS, Spector TD, Syvänen AC, Talmud PJ, Thorleifsson G, Thorsteinsdottir U, Uitterlinden AG, van Duijn CM, Vidal-Puig A, Wild SH, Wright AF, Clegg DJ, Schadt E, Wilson JF, Rudan I, Ripatti S, Borecki IB, Shuldiner AR, Ingelsson E, Jansson JO, Kaplan RC, Gudnason V, Harris TB, Groop L, Kiel DP, Rivadeneira F, Walker M, Barroso I, Vollenweider P, Waeber G, Chambers JC, Kooner JS, Soranzo N, Hirschhorn JN, Stefansson K, Wichmann HE, Ohlsson C, O'Rahilly S, Wareham NJ, Speliotes EK, Fox CS, Laakso M, & Loos RJ (2011). Genetic variation near IRS1 associates with reduced adiposity and an impaired metabolic profile. Nature genetics, 43 (8), 753-60 PMID: 21706003

Sunday, September 18, 2011

Intelligence

This page will serve as a permanent index of all of my writings on intelligence and psychometrics.

The Post-Racial Era is Over – January 8, 2010

Smart People are Educated, Greedy, Sexist Bigots – July 20, 2011

Meet Towelie, the IQ Test of the Future – August 27, 2011

The SAT’s Cohen’s d & the Topography of IQ Denialism – September 2, 2011

The SAT in Red, White, and Brown – September 18, 2011

Girls Versus Boys: The Final Battle – October 9, 2011

Racial Amplitudes of Scholastic Aptitude – April 11, 2012

The SAT Bell Curve – April 25, 2012

Just Say No Limit: Trayvon, Dextromethorphan, Marijuana, and MAOA – July 5, 2012

The Hispanic Asian Flynn Effect – August 5, 2012

Genes Dealt Made Asians Svelte – September 10, 2012

The SAT Zombie Apocalypse – September 29, 2012

Arthur Jensen & JP Rushton – November 1, 2012

Inscrutable Voters – December 6, 2012

Scientists Rediscover the Violence Gene, MAOA-2R – December 30, 2012

The SAT-ACT Score Map – June 10, 2013

Black Suits, Gowns, & Skin: SAT Scores by Income, Education, & Race – October 24, 2013

Parents’ Income Poorly Predicts SAT Score – July 4, 2014

Merit’s Liquidity – October 18, 2014

The SAT in Red, White, and Brown

submit to reddit
The College Board just released another year’s set of SAT results, and Steve Sailer’s blog took notice of the results and the posts that I have recently made on the subject. I try to emphasize science over conjectured analysis on this blog so that my readers can feel some confidence in the knowledge they gain here. Interpreting the SAT is complicated by many factors, including the various tweaks and reforms that the College Board has instituted and the changes in the examinee populations. However, using standard deviations should help in making group comparisons because the students are experiencing the same changes. I have tried to address the differences in demographic groups’ increased participation. In general, every group is increasing their participation more than White people. Here is a graph of each group’s increased participation from the year prior:


When one sees the raw-score graphs below, the trend of Asian advancement is obvious, which exposed the anxieties of many White people in the discussions that I saw. Analysis of the data ultimately becomes a Rorschach test of disposition towards Asian cultures. Clearly, SAT scores are revealing strengths that will serve Asians well wherever meritocracy is allowed. A common reaction from some White people to this data is to try to introduce nuance and critical analysis to emphasize flaws in Eastern societies. I think it is reasonable to conclude that every culture has its flaws, which is a strong argument for cultural exchange. However, I believe that those who are trying to champion these arguments just want to explain away Asian accomplishments to convince Whites that they are superior or at least have enough good points to raise the stock value of racial separation. I have yet to see anyone address the fact that such illustrations could have universal appeal. How does one convince the world that a group of people, like White people, is a nice group without also convincing them that the group is also a nice group to be around? Apparently, White nationalists are trying to posture that every group is nice, but only when each is separate, and mixed groups do not count. I think I can make a stronger case that the success of Asians on the SAT proves that testing is not White-supremacist. In fact, as tuition rates grow, tests are less elitist than education and, therefore, more indicative of important characteristics other than privilege.


Here is the updated graph of the Asian-White score gaps in standard deviations.


Here is the updated graph for the Black-White score gaps.


I have not given much discussion on this blog to people who self-identify as having Hispanic ethnicity or those of Native-American ancestry. I think these can be confusing designations for my purposes because I am interested in genetic research, and such groups have significant ancestral overlap, just as many American White people can claim a fraction of Native-American heritage. I find that these minority groups do not receive as much attention in the scientific literature, probably partly for this reason. Native American SAT scores are based on a relatively small and fluctuating sample size, so I caution against drawing strong conclusions from this graph.


I compiled the three Hispanic groups that the SAT delineates into a single population. The Hispanic sample has grown significantly, so an increasing gap might not surprise. However, I would have expected more changes to the verbal/critical reading score gap, either improvement from acculturation and language mastery or a worsening gap from continued immigration of young non-native speakers. Instead, the math score gap has changed more and seems to have converged with the verbal score gap. I could hypothesize that changes made to the SAT caused it to become a more g-loaded exam like an IQ test because general intelligence is a component of both exam sub-tests. This is a hypothesis that could be tested by re-assembling an older version of the test.


However, the Educational Testing Service’s principal measurement statistician Neil Dorans claimed that the 1995 recentering of the test explains this. “[O]n the original [SAT mathematical] scale, scores below 400 were compressed and scores between 400 and 700 were stretched out…. Hispanic students are 40 points higher at the median on SAT M than on SAT V on the original scale, whereas they have the same median (945) for both SAT M and SAT V on the recentered scale. Thus, the major effect of recentering for Hispanic students was to bring SAT V scores in line with SAT M scores and place both sets of scores closer to the midpoint of the score reporting scale.” He also credited recentering with bringing Asian-American SAT verbal scores “more in line with” SAT math scores. However, recentering was supposed to make each group “appear closer to average on SAT M than they appeared on the original scale,” making Asians, Whites, and men “appear less above average” and do the reverse for Black people, Hispanics, and women, without changing the “rank orderings of individuals.” I wonder if this is why the College Board does not make reports from before the recentering available to the general public. If one ignores the raw score graphs and examines the standard deviation numbers compared to White examinees that are published for Black examinees back to 1986 and for Hispanics back to 1992, one can see that the gaps between Whites and these minorities grew. Perhaps an increased sense of competitive urgency motivated White examinees more after 1995.

Any questions one might still have can be answered with a shrug. Dorans insisted we heed a heedless take on the SAT. “To believe that one set of scales represents ‘truth’ is to reify the score scales in a way that scores on general intelligence tests were reified during the first half of the twentieth century.” Then, he provided a reference to The Mismeasure of Man by Stephen Jay Gould.

Tuesday, September 13, 2011

Attack of the Warrior Gene Babies!

submit to reddit
The so-called “warrior gene” is the reason babies have tantrums. And you thought it was creamed spinach. Okay, I lied. Actually, the first study on the effects of monoamine oxidase A (MAOA) on infants determined that the 3-repeat allele decreases behavioral regulation in Chinese baby girls. Crying was a controlled factor because it could represent fear rather than baby rage. Behavioral regulation was measured by gaze aversion from a menacing toy gorilla. Believe it or not, the inability to do this is associated with childhood externalizing behaviors like fighting and hitting.

The only significant main effect of MAOA was in the girls, which was fodder for interesting discussion of the gender differences and developmental component of the gene’s expression. MAOA is subject to epigenetic methylation, but mostly just in women. The vast majority of that methylation seems to have already occurred by age 5, according to Wong et al. Increased methylation gives women more symptoms of alcohol and nicotine dependence but not antisocial personality disorder, according to Philibert et al. The warrior gene concerns a VNTR (variable number tandem repeat) promoter, but another study by Philibert et al recently discovered a second VNTR that seems to have a greater effect on antisocial personality disorder in women (but not men) than the heavily studied VNTR, and both VNTR influence MAOA methylation in women. The fact that the sex hormones testosterone and estradiol affect MAOA expression should also enter any thorough discussion of sex differences in the warrior gene. Such increasingly complex factors involved in MAOA expression in women are modifying a long-held view that MAOA does not affect women even when it is completely shut off in Brunner syndrome. Or as Dr. Phil put it, “[the warrior gene] is more rare in women, of course” which is not actually true, but at least he is trying.

Speaking of hormones, over the past decade many studies have examined the effects of testosterone and cortisol on aggression. One study determined that testosterone and cortisol even affect the militancy and aggression of Palestinians. Oddly, this research has never seemed to cross paths with research on the proven effects of testosterone and cortisol on MAOA expression. However, scientists have identified a gene-gene interaction between the androgen receptor and glucocorticoid receptor genes, so these might be violence genes just like MAOA, DAT1, DRD2, DRD4, and 5-HTTLPR.

Getting back to the study on babies, this new data also helps clarify the allele frequencies in Asians. I now count a nearly 1,500 cumulative allele sample size among those Asian subjects, predominantly Chinese, for whom selection bias does not apply, and 54% are the warrior gene, which I consider the three-repeat allele (although the much less common 2-repeat allele is also included under this label). This is not much different from that of African Americans, but nearly five percent of African American men have the more violent 2-repeat allele, compared to only one allele of Asian control subjects in the seven studies that I counted. A 2009 editorial that was included in a series of attacks on MAOA research as a reaction to the Rod Lea/Maori controversy claimed Chinese people have the highest warrior gene allele frequency of any ethnic group. That was based on an uncorrected error in The New Zealand Medical Journal that switched the number of subjects (77) with the percentage with the three-repeat allele (55%) from the study by Lu et al. One would think that researchers who study warriors would be more careful.
ResearchBlogging.org


Zhang M, Chen X, Way N, Yoshikawa H, Deng H, Ke X, Yu W, Chen P, He C, Chi X, & Lu Z (2011). The association between infants' self-regulatory behavior and MAOA gene polymorphism. Developmental science, 14 (5), 1059-1065 PMID: 21884321

Zhou Q, Hofer C, Eisenberg N, Reiser M, Spinrad TL, & Fabes RA (2007). The developmental trajectories of attention focusing, attentional and behavioral persistence, and externalizing problems during school-age years. Developmental psychology, 43 (2), 369-85 PMID: 17352545

Wong CC, Caspi A, Williams B, Craig IW, Houts R, Ambler A, Moffitt TE, & Mill J (2010). A longitudinal study of epigenetic variation in twins. Epigenetics : official journal of the DNA Methylation Society, 5 (6), 516-26 PMID: 20505345

Philibert RA, Gunter TD, Beach SR, Brody GH, & Madan A (2008). MAOA methylation is associated with nicotine and alcohol dependence in women. American journal of medical genetics. Part B, Neuropsychiatric genetics : the official publication of the International Society of Psychiatric Genetics, 147B (5), 565-70 PMID: 18454435

Philibert RA, Wernett P, Plume J, Packer H, Brody GH, & Beach SR (2011). Gene environment interactions with a novel variable Monoamine Oxidase A transcriptional enhancer are associated with antisocial personality disorder. Biological psychology, 87 (3), 366-71 PMID: 21554924

Victoroff J, Quota S, Adelman JR, Celinska B, Stern N, Wilcox R, & Sapolsky RM (2011). Support for religio-political aggression among teenaged boys in Gaza: part II: neuroendocrinological findings. Aggressive behavior, 37 (2), 121-32 PMID: 21274850

Chen S, Wang J, Yu G, Liu W, & Pearce D (1997). Androgen and glucocorticoid receptor heterodimer formation. A possible mechanism for mutual inhibition of transcriptional activity. The Journal of biological chemistry, 272 (22), 14087-92 PMID: 9162033

Sue Z. Sabol, Stella Hu, & Dean Hamer (1998). A functional polymorphism in the monoamine oxidase A gene promoter Human Genetics, 103 (3), 273-279 : 10.1007/s004390050816

Ono H, Shirakawa O, Nishiguchi N, Nishimura A, Nushida H, Ueno Y, & Maeda K (2002). No evidence of an association between a functional monoamine oxidase a gene polymorphism and completed suicides. American journal of medical genetics, 114 (3), 340-2 PMID: 11920860

Lu RB, Lee JF, Ko HC, Lin WW, Chen K, & Shih JC (2002). No association of the MAOA gene with alcoholism among Han Chinese males in Taiwan. Progress in neuro-psychopharmacology & biological psychiatry, 26 (3), 457-61 PMID: 11999895

Rosenberg S, Templeton AR, Feigin PD, Lancet D, Beckmann JS, Selig S, Hamer DH, & Skorecki K (2006). The association of DNA sequence variation at the MAOA genetic locus with quantitative behavioural traits in normal males. Human genetics, 120 (4), 447-59 PMID: 16896926

Wang TJ, Huang SY, Lin WW, Lo HY, Wu PL, Wang YS, Wu YS, Ko HC, Shih JC, & Lu RB (2007). Possible interaction between MAOA and DRD2 genes associated with antisocial alcoholism among Han Chinese men in Taiwan. Progress in neuro-psychopharmacology & biological psychiatry, 31 (1), 108-14 PMID: 17007976

Lee SY, Hahn CY, Lee JF, Huang SY, Chen SL, Kuo PH, Lee IH, Yeh TL, Yang YK, Chen SH, Ko HC, & Lu RB (2010). MAOA interacts with the ALDH2 gene in anxiety-depression alcohol dependence. Alcoholism, clinical and experimental research, 34 (7), 1212-8 PMID: 20477771

Patrick-Michael Whittle (2009). Darwinism and the nature of Māori MAI Review

Lea R, & Chambers G (2007). Monoamine oxidase, addiction, and the "warrior" gene hypothesis. The New Zealand medical journal, 120 (1250) PMID: 17339897

Tuesday, September 6, 2011

Pulling the Empty Chair on Dr. Kevin Beaver

I laughed out loud when Bill O’Reilly walked out of an interview with Terry Gross in 2003. The NPR Ombudsman, Jeffrey Dvorkin, rebuked her for conducting an “empty chair interview” after O’Reilly left by asking the questions that he did not let her finish. I had never heard of the term “empty chair interview” before that instance, and while it seems to be a violation of journalist ethics, Gross never apologized to my knowledge, and NPR played the occurrence, even though it was not live.

Well, I have decided to release this empty chair interview with Dr. Kevin Beaver, PhD. Dr. Beaver is a famous criminologist at Florida State University and the author and co-author of numerous published studies and academic texts on biosocial criminology. Mainstream media outlets frequently seek comments from him whenever news breaks about the genetics of violence, and I have cited his research from the beginning of this blog. I briefly shared an email exchange with him that was always cordial and professional, and I requested that he answer a list of questions about his research and this field of study for me to post here. Without objecting to the questions, he refused to answer the questions after seeing this blog because he could not endorse the views contained therein. As a man who spent the greater part of my life getting educated at liberal institutions, I completely understand and sympathize, and I expected this response. I hope that nothing I write ever harms his career or research. Perhaps noting his unwillingness to be associated with this blog will convince whichever would-be detractors he might have that he is well-intentioned and a team player.

I have listed the questions I posed to him below with added links to provide additional background. It is worth a read because I premised the questions with some quick summary points of some of the accomplishments and controversies of the research, where I suspect the research might be going, and criticisms I have of Dr. Beaver’s own research methodologies. I welcome any critical comments of my journalistic ethics or otherwise. Of course, many differences exist between this post and the NPR example that I mentioned. First of all, I am not a journalist, and I am not remunerated as Gross is. Secondly, my questions are more informative and required more research than Gross reading from People magazine. Lastly, Dr. Beaver received a copy of all questions and is exercising his prerogative to not respond at all.

In defense of the blog, itself, I do not consider my writings to be mean-spirited or racist. In fact, I have on multiple occasions made an effort to debunk the views of those whom I would label as “white nationalists.” I make no apologies for confronting the pseudo-controversies regarding the validity of IQ, the usefulness of “race” in medical research, and, indeed, the inherently sensitive subjects that Dr. Beaver broaches in his work. In each case, I see a matter of life-and-death importance, and I shall expound on that characterization in future posts. I think a fair assessment of this blog would label it the least radical of the many “human biodiversity” or “race realist” sites. Among these I would include Gene Expression, which carries the imprimatur of Discovery Communications and the Unz Foundation. Its author, Razib Khan, regularly interviews noted academics and authors, and his status seems undiminished by his somewhat outside-the-traditional-mainstream takes on eugenics and whether egalitarian policies should end due to the high heritability of IQ. Oh, and I have never called any of my commenters a “retard.”

Perhaps a savvy reporter will review this page next time before seeking a sound bite from Dr. Beaver. If not, I am glad that I brought these unrequited inquiries to a researcher’s attention, and I insist on interpreting the reticence as a testament to the need for a blog titled The Unsilenced Science.

***********************************************
A June New York Times article that quoted you also mentioned a forensic science panel on creating a genetic database during the first day of the National Institute of Justice conference. How can we obtain more information about the panel discussion? Are minutes available? Will the database allow public viewing?

The New York Times article said that you agreed with the view that “hundreds or thousands of genes” contribute to aggressive behavior as is the case for many complex behaviors. Why should we consider aggression a complex behavior?

Does this view discourage you from studying small numbers of genes, as you have been doing?

The only genome-wide association study of which I am aware related to psychopathy was Viding et al, “In search of genes associated with risk for psychopathic tendencies in children: a two-stage genome-wide association study of pooled DNA.” Are you aware of other such studies that have or will be published?

Do you have any plans to participate in making a genome-wide association study?

Viding et al did not find major genetic loci for psychopathic tendencies in children. Do you expect that aggressive behavior has no especially important genetic loci?

It is my understanding that genome-wide association studies cannot address VNTR components. Therefore, they would not compare the most studied variants of genes like MAOA. How should we reconcile research of such genes with studies like Viding et al?

Do you see any kind of study like a genome-wide association study actually taking VNTR into account in the future?

In your studies of MAOA, you used the convention of including the 2-repeat and 3-repeat alleles in the category MAOA-L, but Guo et al “The integration of genetic propensities into social-control models of delinquency and violence among male youths” and Guo et al “The VNTR 2 repeat in MAOA and delinquent behavior in adolescence and young adulthood: associations and MAOA promoter activity” found that the 2-repeat allele had twice as much effect on violent delinquency as either the 3-repeat or 4-repeat alleles and that the 2-repeat allele had more effect than the dopamine genes DAT1 and DRD2. How do you justify following the MAOA-L convention rather than studying the 2-repeat allele separately?

In your study “Genetic risk, parent-child relations, and antisocial phenotypes in a sample of African-American males” you studied MAOA and four autosomal genes. You created an index with the maximum score of 9. Is it correct, therefore, that the X-chromosome MAOA allele was counted as equal to only one allele of an autosomal pair of alleles? Would not the hemizygosity of the X-chromosome allow for increased impact of its alleles?

Why did you decide to not calculate constants to differentially weight genes in this study, as you suggested be studied in the discussion?

Table 4 showed a statistically significant p-value for your genetic index affecting adult violent delinquency but not for parent-child relations. Why did you not highlight this finding in the abstract? Is it wrong to view this as evidence that “nature” has more impact than “nurture”?

According to Scopus, only five studies have cited this study, and all five were by you and your research team. Do you have any thoughts regarding why so few other researcher teams are currently building upon your work?

Why did you decide to exclude the genes MAOA and 5-HTTLPR from the genetic index that you created in “The association between genetic risk and contact with the criminal justice system in a sample of Hispanics”?

According to my PubMed searches, research on MAOA and aggression or antisocial personality disorder has been published at a slower rate since about the time that you started publishing studies on the subject. Have you noticed this, and, if so, do you have any thoughts on the matter?

Much of the research on MAOA seemed to be in response to the Caspi et al study “Role of genotype in the cycle of violence in maltreated children.” His team published a similar study on 5-HTTLPR and depression, which seemed to produce a backlash against all candidate gene research as evidenced by Risch et al “Interaction between the serotonin transporter gene (5-HTTLPR), stressful life events, and risk of depression.” The Uher et al study “Serotonin transporter gene moderates childhood maltreatment’s effects on persistent but not single-episode depression: replications and implications for resolving inconsistent results” seemed to try to counter this sentiment in press reports. Have you noticed that this back-and-forth has had any impact on how your candidate gene research is received?

Is violent behavior a disease?

A disproportionate number of studies on MAOA and antisocial personality disorder were negative (Saito et al, Koller et al, Parsian et al, Lu et al, and Prichard et al). Why should antisocial personality disorder be a focus of genetic research? Should not the aggression or impulsive criteria of antisocial personality disorder be considered separately in genetic studies?

Why have you never studied the genetics of intermittent explosive disorder?

Do you see the Diagnostic and Statistical Manual of Mental Disorders (DSM) as adequate in addressing these subjects?

Have you been in contact with anyone regarding the shaping of DSM-V?

Other studies (Chakrovorty and Halbreich, Chevillard et al, Gundlah et al, Klaiber et al, Luine et al, Ma et al, Ou et al, Redmond et al, Sjoberg et al, and Smith et al) suggest MAOA interacts with the hormones testosterone, estradiol, and cortisol. Why have you chosen to not include hormonal factors in your research? Could not an index that includes multiple aggression-associated genes, hormone levels, and hormone receptor genetic alleles produce more powerful results?

Fowler et al “Brain monoamine oxidase A inhibition in cigarette smokers” found that smoking lowers brain MAOA. Why have you not included smoking status as a factor in your studies—or have I missed you doing so?

You appeared in the National Geographic documentary on MAOA. Have you seen the completed version, and would you care to comment on it?

When this documentary came out, the Dr. Phil program also dedicated an episode to MAOA. Have you seen that, and would you care to comment on it?

You opposed the decision by an Italian court to reduce the sentence of Abdelmalek Bayout, but the testimony of Dr. William Bernet helped do something similar for Bradley Waldroup in Tennessee. Did Dr. Bernet act irresponsibly?

What steps would you recommend that our criminal justice system take regarding exculpatory genetic evidence of this sort?

Should the insanity defense be expanded or contracted based on your research?

How, if at all, have the controversies associated with biosocial criminology impeded your work?

Prior to your research on MAOA, some studies and editorials cited Widom and Brzustowicz “MAOA and the ‘cycle of violence:’ childhood abuse and neglect, MAOA genotype, and risk for violent and antisocial behavior” that questioned “the suitability of using the MAOA promoter VNTR polymorphism as a proxy for MAOA levels in non-white populations” based on a comparison between whites and non-whites of unrevealed ethnic proportions and without taking gender into account. Would you say that your research has upset the potential for racial harmony on this issue and made studying the genetics of violence more difficult?

Are you familiar with the controversy surrounding Dr. Rod Lea, the New Zealand scientist who was quoted as saying that his research on MAOA “has implications suggesting links with criminality among Maori people”? Do you have an opinion on how he or the media acted during that controversy?

In general, Asian societies like Japan have low rates of violent crime, but East Asians have higher rates of violence-associated alleles, including the 3-repeat allele of MAOA, the short allele of 5-HTTLPR, and the 10R allele of DAT1. Do those facts seem contradictory to you, or do you see a possible explanation?

Chiao and Blizinsky in “Culture-gene coevolution of individualism-collectivism and the serotonin transporter gene” suggested that culture evolves with specific alleles to prevent side effects like depression in those with the short allele of 5-HTTLPR. Do you have thoughts on this hypothesis, and have you considered conducting research related to culture-gene coevolution and aggression?

Has the decline in crime rates made your work in biosocial criminology more or less challenging and in what ways?

What plans do you have for future research on the genetics of aggression?

Are there additional candidate genes that you would like to include in future research?

Are you planning on studying or have interest in searching for individuals with Brunner syndrome?