Showing posts with label race. Show all posts

Saturday, October 18, 2014

Merit’s Liquidity

Over the past year, multiple major media outlets and a powerful university president or two have been agitating about the correlation between parents’ income and SAT scores. Over that same time period, editors of various psychology journals were rejecting my regression study to determine the true influence of parents’ income on SAT scores while controlling for other possible factors because the study did not “make clear what the gap or problem is in the literature and exactly how the present study fills that gap.” If I cannot convince a journal that a lack of an examination on the influence of socioeconomic status in the entire 87-year history of America’s most important academic test is a gap in the literature, then what hope remains for my other project on the interplay of body-mass index and perspiration on navel lint accumulation?

Part of the problem resulted from my need to rely heavily on years of state averages, rather than the scores of individual students, but I am convinced that anyone who manages to gain access to individual data will merely corroborate my work at much greater expense. One editor conceded, “I agree that there is something we can learn from these data,” despite rejecting my work anyway. Ultimately, the new open-access journal, Open Differential Psychology published the study.

Last week, the College Board released the latest year’s SAT results. The organization cleverly released its “benchmarks” report the day before their usual, more detailed report. Reporters were too lazy to report on the subject two days in a row, let alone do any analysis. Blasé headlines declared scores “flat,” as they would for any two-consecutive-year analysis. I found the numbers fascinating. They dovetail with my study and other previous writings and flesh out some trends the media missed.

In my study I addressed the overlooked fact that correlations between parents’ education and (individual) SAT score and between parents’ income and SAT score have not been constant over time.
Family educational advantage seems to evince virtually undeviating growth as a predictor of SAT scores, but financial advantage seems to grow as the economy worsens. Rather than postulate that times of economic difficulty almost immediately make wealthy people smarter, one should focus on the exclusivity of the income category.


2014 brought new record advantages to students whose parents have bachelor’s or graduate degrees on the critical-reading and mathematics subtests. This fact can inform discussion about the notion of an “education bubble.” The expansion of college access has raised concerns over indebtedness, falling standards, and underemployment, but, while these concerns are likely to grow, education appears increasingly to benefit the following generation as if to demonstrate that the ability of higher education to sift and inculcate basic skills remains intact, or at least it did one generation ago.

The difference between the yearly trends for the SAT-score benefit of education to a family compared to the benefit of coming from a home with a higher income startled me, especially given the sharp drop in income advantage coinciding with the 2008 economic downturn. So, I graphed income’s SAT advantage with US gross domestic product (GDP) growth rate. The graphs almost perfectly coincide when the income divide compares families above $100,000 to those below that.


My regression study included a control for year, but an even more detailed study of the influence of family income could benefit by controlling for the state of the economy, as I suggested in my concluding remarks.
Perhaps additional or alternative variables could be identified. For instance, year was significant in some regression iterations but had small β values. Perhaps year is a proxy variable for other factors like the state of the economy.

The graph provides convincing evidence that there is some kind of causal relationship between the economy and SAT scores despite the relatively low influence of parents’ income on scores in the regression analysis. Student stress or mood seems more plausible as a mechanism than radical yearly changes in educational quality, but my point about exclusivity concerned whether economic slowdown weeded out low test performers from higher economic strata due to the heritable component of cognitive ability shared between the parents and the student. However, for that to be the mechanism, one would expect GDP to look more like a leading indicator of test performance or for the slope of the growth rate to tend to be the negative of the slope of test scores over time. This graph actually seems to indicate that poor economies weed out high test performers from higher economic strata. In The Bell Curve, Richard Herrnstein and Charles Murray claimed that the twenty-first century would continue “the emergence of a cognitive elite.”
The isolation of the brightest from the rest of society is already extreme; the forces driving it are growing stronger rather than weaker.
Of course, the economy of the 1990’s, when they wrote that, usually appeared to be growing stronger rather than weaker.

I can imagine two mechanisms for economic contraction weeding out smart families from the upper class: circumstances cause the power elite to lose interest in the power of ideas, and some upstarts’ ideas were not that good from the start. I suspect both are at work. The first mechanism supports a leftist or Marxist vision of ensconced aristocracy holding the privileges of power and leisure. If recessions interspersed with periods of anemic growth are “the new normal,” then The Bell Curve was partly wrong, and economic populism should be of interest to the so-called cognitive elite. On the other hand, when bad ideas create bad economies, perhaps the cognitive elite receive their just desserts. Some people who are obsessed with IQ research engage in some paradoxically simplistic thinking. As anyone who has surveyed the differential psychology literature about liberals versus conservatives or even the results for the SAT Student Descriptive Questionnaire can attest, the best indicator of dimness is indifference. Wrong ideas also sometimes require intelligent formulation. Spectacularly wrong ideas receive their negative appraisal in retrospect because they were compelling enough to do damage. Moreover, misbegotten hype might serve as a more commonly available vehicle of upward mobility for smart upstarts than truly transformative ideas.

Wisdom and top-down analytic ability sadly receive fewer lauds than the clichés “street smarts” and “common sense.” To illustrate the distinctiveness of wisdom from intelligence so as to support the notion that smart people might promote unwise ideas, I would like to analogize with my personal experience working with engineers and doctors. Many of the engineers whom I have known work hard on mundane projects but like to engage in fascinating discussions about politics, metaphysics, and, of course, the possibility of alien life forms. They contrast with neurologists and neurosurgeons whom I have met who regularly work with cases of alexia without agraphia and amygdalectomy but remain willfully indifferent to any profound questions these phenomena raise about the soul or free will. If emphasis on analytic ability (as opposed to memory) is analogous to “wisdom,” then the engineers are the aristocrats in this analogy, although engineers often zealously advocate for their upstart ideas. I think most people assume that doctors are smarter than engineers because becoming a doctor is harder and better reimbursed, but I would say engineers are deeper conversationalists, which manifests a certain type of wisdom to me.


Merit’s Mobility

Though the 90’s are long gone, Bill Clinton might still point out that this is not “midnight in America.” The American economy usually does expand, and smart people disproportionately tend to be the proverbial movers and shakers. Hints of this appear as evidence for their geographical mobility based on yearly maps of SAT and ACT data. Racial demographics also relate to test scores and have their own trends of time and place.


Last year, I graphed all data from state SAT reports for SAT scores of different family income brackets according to the proportion of each state’s population that belongs to the two highest scoring racial groups, whites and Asians. As the updated version above shows, students from the wealthiest category have the lowest association between state racial demographics and SAT score. One reader considered this “evidence against a genetic explanation.” Of course, homes earning less than $80,000 per year are not all dealing with “typical environmental problems of poverty.” Part of my study’s regression analysis looked at the effects on SAT scores that were common to both income and race. These effects existed when the income cutoff was $100,000 but not $20,000. Without completely dismissing the environmental hypothesis, I pointed out alternative factors that could be at work. An alternative explanation for the graph could be that higher income families with good test performance are more likely to live in racially diverse states compared to other income levels, since the racial proportions pertain to the states, not the income brackets, themselves. It turns out that SAT data does offer some support for my previous contention that “racially diverse states like California have industries or attractions that pull in successful, educated whites.”

Before revealing the map that demonstrates this, I shall review the latest SAT and ACT data by race. Composite ACT-SAT scores by race are very similar to the year before.


Native-American scores remain just slightly above those of Hispanic Americans after a significant drop in Native-American ACT scores from 2010 to 2013.


Overall, Asian scores have continued their amazing progress. The Asian SAT mathematics subtest advantage over whites rose to 64 points.


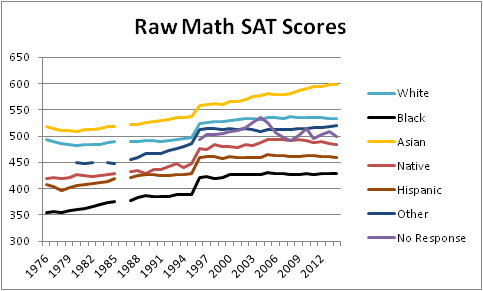
Asians are not closer to surpassing whites on the critical-reading subtest only because white scores rose by the same amount this year.


In contrast to all other groups, Asian SAT writing subtest scores rose in seven of the past nine years.


However, Asian progress on the ACT did appear to stop. Their scores on the reading and math subtests even slightly dropped. The average score drop for Pacific Islanders, for whom scores are available only in recent ACT data, was quite severe this year: almost a full composite ACT point. Fortunately for Pacific Islanders, this probably only resulted from a massive, 19-percent increase in ACT participation. Hawaiian students, who were 83 percent Asian-American, according to SAT numbers, bumped up their ACT participation from 40 percent to 90 percent, while their SAT participation rate barely budged at 63 percent. Asian students have been the one racial group who heavily favor taking the SAT rather than the ACT. This is likely due in large measure to foreign students. As the following graph shows, ACT participation surpassed that of the SAT, driven mostly by white students.


It would be tempting to surmise that foreign students are causing the continued progress of Asians on the SAT, but, as I previously discussed, the scores of foreign students (represented on the following graph as colored lines of a negative advantage for American students) still closely resemble Asian SAT scores (represented as gray lines for a negative white advantage), while the number of foreign students could not overwhelm the number of Asian students.


Indeed, Asian progress has been so impressive that it calls into question some assumptions of experts in differential psychology and adherents to the philosophy behind so-called “human biodiversity.” Rather than reveal a unitary Asian-white general intelligence gap, Asians have always had a large mathematics advantage. Rather than maintain a constant mathematics gap as Asians improve their English skills, Asian mathematics, reading, and writing skills improved in tandem. Rather than have SAT scores that coincide with research on the secular IQ gains, known as the Flynn effect, Asian SAT gains have been large at the same time as their IQ gains have been small, and white SAT gains have been small, as large IQ gains in Western societies have continued unabated. Frey and Detterman famously called the SAT an IQ test in 2004, but they offered no explanation for why their IQ-estimation equation essentially eliminated the reading subtest. Murray recently defended The Bell Curve by pointing out how little the black-white test score gap has changed. So, what is the precise meaning of that, given that the Asian-white gap has changed so greatly?

What should be clear from the preceding review of new data is that participation rates greatly matter. Hawaii’s ACT scores fell this year by almost two points on a scale from 11 to 36, following its participation increase. In order to appropriately map composite ACT-SAT scores, I must follow my previously described methodology for adjusting scores according to state SAT and ACT participation rates.

For comparison, here is the map of the percentage of white and Asian SAT-taking students over the years:

 photo sat aw map.gif


Student diversity increased especially among coastal states. I previously claimed, “Demographic changes correspond to falling test scores, and one can see it, at least in terms of a North-South divide, on these maps.” The most recent years of this participation-controlled composite SAT-ACT score map make me want to amend that assessment.

 photo sat-act part cont.gif


One can more easily notice the change by just looking at the oldest and newest maps without animation.


The earliest year does suggest a North-South divide, but the coastal states of California, Georgia, South Carolina, and North Carolina improved, while some Mountain states declined. The trend could be a fluke, and a few states buck the trend, but it fits with my previous explanation of diverse states attracting relatively well scoring students from wealthy families. The upper class wishes to live near beaches and in high-status states with impressive cultural and educational institutions. Many of the cognitive elite actually might like some kinds of racial diversity. Southern states like Louisiana have not improved, or, in the case of Mississippi, scores improved but were already extremely low. Perhaps the cognitive elite would be attracted to this Southern coast but find Southern culture too alienating, and maybe such a feeling of alienation from otherwise attractive settings makes liberal condescension slightly more understandable.

In an era that made “big data” a catchphrase, the colossal data pool that describes the colossal sample who took these tests inspires elite news outlets to make bar graphs of simple correlations and reports of flat scores. I call that flat reporting.


ResearchBlogging.org


nooffensebut (2014). Parents’ Income is a Poor Predictor of SAT Score Open Differential Psychology, 1-19

Thursday, July 10, 2014

Christopher Irwin Smith is an Idiot


Poopy-Faced Idiot

Deep inside an underground compound within the evil lair of the American Anthropological Association, Lord Skeletor summoned a scientist to spread falsehoods about the science of monoamine oxidase A, the warrior gene. That scientist was Christopher Irwin Smith, Associate Professor of Biology at Willamette University. Dr. Smith set about penning a diatribe full of errors and misleading innuendo. “I shall post this on the Internet and not allow better-informed people to comment on it,” he muttered before mustering an evil cackle that echoed through his dark private chamber.

Our investigators have uncovered the following especially telling response comment:

Dr. Smith,

Your impressive background prevents me from having any sympathy for you regarding the multiple egregious errors in this post. Probably the worst aspect of it is the timing because the last two years have produced two important meta-analyses confirming MAOA as an aggression and antisocial behavior gene. I’m guessing you have no awareness of either one.

“…Nielsen and Williamson’s studies were able to identify many regions in the genome that appear to have experienced recent natural selection, but MAO-A is not one of them.”

You neglected to mention that their study examined single-nucleotide polymorphisms, not repeat polymorphisms, like either of the functional MAOA-uVNTR promoters. The same is true for Voight et al.

“it is likely that these genetic variants are not –on their own– associated with violent or impulsive behavior… Simply carrying the ‘low expression’ allele in the MAO-A promoter does not have any effect at all on impulsivity or aggression.”

I doubt that you would have written this if you had been aware of the new meta-analysis by Ficks and Waldman, which came to the opposite conclusion.

“Instead, genetic variation in the MAO-A promoter seems to make some children less able to recover from abuse and childhood trauma, and therefore more likely to act out later in life (Caspi et al. 2002; Widom & Brzustowicz 2006).”

You are misrepresenting the findings of Caspi et al. It is MAOA-4R, not MAOA-3R that has the effect, which is a protective effect. According to Caspi et al, abuse could not affect those with MAOA-4R at all. Other studies have found the same protective effect against high testosterone levels and low IQ. Byrd and Manuck recently provided a meta-analysis verifying the abuse-MAOA interaction effect.

“Indeed, genetic variants associated with lower resilience to trauma are most common in Asian populations, not African ones (Sabol et al. 1998).”

Are you seriously saying that 61.0% is significantly higher than 59.1%? I think you must have been thinking about the copy-and-paste error by Lea and Chambers that claimed that 77% of Chinese men have MAOA-3R. I have labeled that the “idiot test” because it has caught many highly credentialed idiots who were trying to do the same thing that you are trying to do now: brush off decades of good research on MAOA. Ficks and Waldman only found a modest main effect of MAOA-3R, so you would need to argue not only that the gene is as common in Asians but also that the interacting factors (child abuse, high testosterone, an IQ less than 85) are as common in Asians, as well. Then, there is the issue of MAOA-2R….

“Note that Sabol study did not consider differences between populations in the frequencies of the ‘2-repeat’ alleles that Wade references…”

Did not consider? Gee, that is an interesting way of putting it. Of course, they tried to determine the allele frequency of each kind of allele in that VNTR, and they reported absolutely no instances of MAOA-2R in any group out of a total sample of over 2,000 X-chromosomes. MAOA-2R had not been discovered until the next year by Kunugi et al. Ever since, we have known that MAOA-2R is rare in whites but not that rare. Something is seriously wrong with the Sabol et al allele frequencies.

“To my knowledge, the frequency of the 2-repeat allele across populations has not been extensively measured; studies that have looked at its incidence appear to have focused on specific cohorts in the US as part of epidemiological studies.”

Is this your way of trying to cast doubt upon the allele frequencies reported in the literature for MAOA-2R in African-American men? Establishing an allele frequency does not require a 31-study meta-analysis. We have consistent findings from multiple studies that MAOA-2R is many times more common in African-American men than either white or Asian men. Would you like to read each study?

Friday, July 4, 2014

Parents’ Income Poorly Predicts SAT Score


Abstract
Parents’ annual income lacks statistical significance as a predictor of state SAT scores when additional variables are well controlled. Spearman rank correlation coefficients reveal parents’ income to be a weaker predictor of average SAT scores for each income bracket within each state than parents’ education level as a predictor of average SAT scores for each education level within each state. Multiple linear regression of state SAT scores with covariates for sample size, state participation, year, and each possible combination of ordinal variables for parents’ income, parents’ education, and race shows income to lack statistical significance in 49% of the iterations with greater frequency of insignificance among iterations with higher explained variance. Cohen’s d comparisons of the yearly individual SAT advantage of having educated parents show a fairly consistently increasing positive relationship over time, whereas similar analysis of the yearly individual SAT advantage of having high-income parents shows variability somewhat coinciding with the business cycle.

Read the whole study at Open Differential Psychology.

See below for important excerpts and extra super-awesome graphs.

“Sackett et al (2009) recounted a series of accusations that the SAT merely measures family wealth. The College Board’s announcement of 2016 SAT reforms has stirred anew claims that 'the only persistent statistical result from the SAT is the correlation between high income and high test scores' (Botstein, 2014). Thus, income as an important predictor of SAT scores somewhat fits a view critical of the SAT, which is that financial resources and class privilege unduly enable higher SAT achievement. If the education component of socioeconomic status dominates over the income component, then the relationship between socioeconomic status and scores might instead more accurately reflect a family’s values towards education and a hereditary influence shared between test performance and educability.”

“This study seeks to thoroughly parse the effects of multiple covariates, including family income, parents’ highest education level, and potential confounding variables specific to state or multiple-year comparisons. To do this, full advantage will be taken from all sixteen years of state data.”


Income p-values without race as a covariate (p-values are shown on an inverse logarithmic scale)


Income p-values with race as a covariate (p-values are shown on an inverse logarithmic scale)

“The racial variable was the most consistently significant variable of these three ordinal variables for composite scores and subtests, which speaks to its independence from socioeconomic status. Race also explained much of the SAT advantage that appeared to be attributable to parents’ income prior to the addition of the racial variable in iterations with low income thresholds simultaneous with the education cutoff being graduate degree.”


Critical-reading and mathematics standardized coefficients compared to adjusted R2 values, organized by education first, race within each educational category, and income within each racial category

“Parents’ income has a significant association with SAT scores, but parents’ education is consistently stronger, and regression with effective controls for race, education, and other factors, usually suppresses the income variable to insignificance. The income variable achieved significance when the education threshold was high school diploma most likely because so few parents were dropouts that education was no longer effectively controlled, and parents’ income became a proxy variable for parents’ education…. Part of this dominance could result from heritability in test performance corresponding to parents’ educational attainment, given the high heritability estimates from twins studies for high-stakes standardized exams in the UK and the Netherlands (Bartels et al, 2002; Shakeshaft et al, 2013).”

“Figure 1 seems to contradict Dixon- Román et al in finding that the racial variable had its greatest influence at the highest education level and at high income levels.”

“Asian Americans have historically high average mathematics subtest scores but lower verbal/critical-reading average scores than the white majority…. Despite their likely small average verbal disadvantage and small population in many states, this study’s consistent regression results for Asian race match verifiable individual SAT-score phenomena. A study with fewer observations, a much smaller represented sample, or fewer or poorly chosen covariates might not have achieved that level of definition, but, fundamentally, states do not take the SAT; people do.”


Cohen’s d SAT advantage of having parents’ annual income above $60,000

“Family educational advantage seems to evince virtually undeviating growth as a predictor of SAT scores, but financial advantage seems to grow as the economy worsens. Rather than postulate that times of economic difficulty almost immediately make wealthy people smarter, one should focus on the exclusivity of the income category…. The declining relative income advantage on the mathematics subtest compared to the critical-reading subtest also could be related to structural changes to the economy since the decline of the high-technology boom of the 1990’s, which also fits this interpretation of persistence within families.”

For those readers who do not have a heart condition, I recommend the spirited and colorful statistics debate in the open peer-review forum. One may also find there data supplements of state data that required many months of typing out the data from 816 state reports into a database, which makes a fun toy.


ResearchBlogging.org


nooffensebut (2014). Parents’ Income is a Poor Predictor of SAT Score Open Differential Psychology, 1-19

Ariel Investments. (2010). The Ariel Investments 2010 black investor survey: Saving and investing among higher income African-American and white Americans. Retrieved April 1, 2014 from http://www.arielinvestments.com/landmark-surveys/

Balf, T. (2014). The story behind the SAT overhaul. New York Times. Retrieved March 25, 2014 from http://www.nytimes.com/2014/03/09/magazine/the-story-behind-the-sat-overhaul.html.

Bartels M, Rietveld MJ, Van Baal GC, & Boomsma DI (2002). Heritability of educational achievement in 12-year-olds and the overlap with cognitive ability. Twin research : the official journal of the International Society for Twin Studies, 5 (6), 544-53 PMID: 12573186

Botstein, L. (2014). College president: SAT is part hoax, part fraud. Time. Retrieved March 25, 2014 from http://time.com/15199/college-president-sat-is-part-hoax-and-part-fraud/.

Buchmann, C., Condron, D., & Roscigno, V. (2010). Shadow Education, American Style: Test Preparation, the SAT and College Enrollment Social Forces, 89 (2), 435-461 DOI: 10.1353/sof.2010.0105

Dixon-Román, E.J., Everson, H.T., & McArdle, J.J. (2013). Race, poverty and SAT scores: Modeling the influences of family income on black and white high school students’ SAT performance. Teachers College Record, 115 (4), 1-33

Duckworth AL, Quinn PD, Lynam DR, Loeber R, & Stouthamer-Loeber M (2011). Role of test motivation in intelligence testing. Proceedings of the National Academy of Sciences of the United States of America, 108 (19), 7716-20 PMID: 21518867

Duncan, J., Seitz, R.J., Kolodny, J., Bor, D., Herzog, H., Ahmed, A., Newell, F.N., & Emslie, H. (2000). A Neural Basis for General Intelligence Science, 289 (5478), 457-460 DOI: 10.1126/science.289.5478.457

Everson, H.T., and Millsap, R.E. (2004). Beyond individual differences: Exploring school effects on SAT scores. (RR-2004-3). New York: College Board.

MacCallum RC, Wegener DT, Uchino BN, & Fabrigar LR (1993). The problem of equivalent models in applications of covariance structure analysis. Psychological bulletin, 114 (1), 185-99 PMID: 8346326

Marioni RE, Davies G, Hayward C, Liewald D, Kerr SM, Campbell A, Luciano M, Smith BH, Padmanabhan S, Hocking LJ, Hastie ND, Wright AF, Porteous DJ, Visscher PM, & Deary IJ (2014). Molecular genetic contributions to socioeconomic status and intelligence. Intelligence, 44 (100), 26-32 PMID: 24944428

Neter, J., Wasserman, W., and Kutner, M.H. (1983). Applied Linear Regression Models. Homewood, IL: Richard D. Irwin, Inc.

Prescott, B.T., and Bransberger, P. (2012). Knocking at the College Door: Projections of High School Graduates (eighth edition). Boulder, CO: Western Interstate Commission for Higher Education.

Sackett PR, Kuncel NR, Arneson JJ, Cooper SR, & Waters SD (2009). Does socioeconomic status explain the relationship between admissions tests and post-secondary academic performance? Psychological bulletin, 135 (1), 1-22 PMID: 19210051

Sackett PR, Kuncel NR, Beatty AS, Rigdon JL, Shen W, & Kiger TB (2012). The role of socioeconomic status in SAT-grade relationships and in college admissions decisions. Psychological science, 23 (9), 1000-7 PMID: 22858524

Schmitt N, Keeney J, Oswald FL, Pleskac TJ, Billington AQ, Sinha R, & Zorzie M (2009). Prediction of 4-year college student performance using cognitive and noncognitive predictors and the impact on demographic status of admitted students. The Journal of applied psychology, 94 (6), 1479-97 PMID: 19916657

Shakeshaft NG, Trzaskowski M, McMillan A, Rimfeld K, Krapohl E, Haworth CM, Dale PS, & Plomin R (2013). Strong genetic influence on a UK nationwide test of educational achievement at the end of compulsory education at age 16. PloS one, 8 (12) PMID: 24349000

Trzaskowski M, Harlaar N, Arden R, Krapohl E, Rimfeld K, McMillan A, Dale PS, & Plomin R (2014). Genetic influence on family socioeconomic status and children's intelligence. Intelligence, 42 (100), 83-88 PMID: 24489417

US Census Bureau. (1990). Asians and Pacific Islanders in the United States. Retrieved March 23, 2014 from https://www.census.gov/prod/cen1990/cp3/cp-3-5.pdf.

US Census Bureau. (2013). Asian/Pacific American Heritage Month: May 2013. Retrieved March 24, 2014 from https://www.census.gov/newsroom/releases/pdf/cb13ff-09_asian.pdf.

Monday, December 23, 2013

Dr. Kevin Beaver the Apostle


In the discussion following my previous video about monoamine oxidase A, I noted a new study with lead author Dr. Kevin Beaver. The study closely resembles his previous study of the 2-repeat allele, my analysis of which is well on its way to becoming my most popular blog essay. Once again, a small subset of African-American men from the National Longitudinal Study of Adolescent Health served as a comparison group for the eight African-American men, who possess this rare allele of the upstream promoter for MAOA and who had complete phenotype data. This time, the specific behaviors of shooting or stabbing replaced measures of psychopathic personality, arrests, and incarceration as the outcomes of interest. Despite the small sample size, the results were significant (odds ratio = 12.89, p < 0.05) because those with the allele had a fifty-percent chance of shooting or stabbing someone. For African-American men without this allele, the risk was only seven percent. Those with MAOA-2R were also more likely to have victimized multiple people based on their greater likelihood of admitting stabbing or shooting during multiple “waves” of study follow-up.

I still have concerns about population substructure. In a mixed population like African Americans, alleles associated with African ancestry like MAOA-2R might correlate with many other African alleles, and because MAOA-2R is so much more common in African Americans than whites and Asians, scientists have studied no other sample and no other race for behavioral phenotypes specifically for this allele. However, Guo et al previously demonstrated the functional differences between MAOA-2R and the other alleles in vitro.

This study bares the imprint of my influence. I previously sent Beaver a list of questions that reflected beliefs of mine about the research on this gene. Here was one such question:
In your studies of MAOA, you used the convention of including the 2-repeat and 3-repeat alleles in the category MAOA-L, but Guo et al “The integration of genetic propensities into social-control models of delinquency and violence among male youths” and Guo et al “The VNTR 2 repeat in MAOA and delinquent behavior in adolescence and young adulthood: associations and MAOA promoter activity” found that the 2-repeat allele had twice as much effect on violent delinquency as either the 3-repeat or 4-repeat alleles and that the 2-repeat allele had more effect than the dopamine genes DAT1 and DRD2. How do you justify following the MAOA-L convention rather than studying the 2-repeat allele separately?
In this study, Beaver et al make the following similar remark:
[A]lmost all of the prior research examining the effects of MAOA on antisocial behaviors has pooled the 2-repeat allele together with the 3-repeat allele. As the results of this study indicate, however, this approach may be misguided as the most powerful effects may be found within the 2-repeat allele and combining the 2-repeat allele with the 3-repeat allele may attenuate the main effects of MAOA.
I raised another concern in a separate question:
A disproportionate number of studies on MAOA and antisocial personality disorder were negative (Saito et al, Koller et al, Parsian et al, Lu et al, and Prichard et al). Why should antisocial personality disorder be a focus of genetic research? Should not the aggression or impulsive criteria of antisocial personality disorder be considered separately in genetic studies?
Beaver et al echo my concern:
Using an additive scale of antisocial behaviors may mask important heterogeneity that exists between the individual behaviors and MAOA genotype such that MAOA may be related to certain types of antisocial behaviors, but not others. As a result, to further unpack the nexus between MAOA genotype and serious violence, the current study examines only extreme violence as measured by shooting and stabbing behaviors.
Neuroskeptic, who has been a reader of the Unsilenced Science, responded to the study by saying, “Hmmm,” to which neurogeneticist Dr. Kevin Mitchell responded, “Grrrrr,” undoubtedly while pounding his chest. University of North Carolina geneticist Dr. Patrick Sullivan wrote, “I would have rejected wo review. Studies like these have not taught us much.” By “studies like these,” I assume he means the hundreds of corroborating studies pertaining to the MAOA gene, its enzyme, and its metabolites, but dismissive flippancy from genetics professors is the sign of the times. Mitchell passed along my recent video to his fellow GWAS Jihadists “based on the title,” which is clearly a Christmas miracle. I, for one, generally do not consider candidate-gene studies with large effect sizes to be evidence of no effect at all “by historical analogy.” In the past, interesting studies would lead to attempts to replicate the finding. Often some attempts would support, others would not, and a meta-analysis of all pertinent results would provide the final word. Now, some attempts support, and every attempt that does not support the original finding is evidence of a broader dysfunction in medicine or science, which are to blame for the media’s hype. Only a select few GWAS Jihadists have the moral courage to dismiss every positive finding with a self-righteous fist pound on the lectern. Nevertheless, Vimaleswaran et al determined that candidate-gene studies, which follow hypotheses about specific genes, show “evidence for enrichment” when compared to genome-wide association studies (for obesity) such that “the candidate gene approach retains some value.” Tielbeek et al attempted to test MAOA in a GWAS that only examined single nucleotide polymorphisms and found no effects for antisocial behavior. Of course, such a study could not directly examine the VNTR promoters that have drawn so much interest to this gene.

Eight is a small number of cases, but it is approximately the same as the number of cases of Brunner syndrome when that diagnosis was established in 1993, a diagnosis that only recently came into use for two additional families. When I first confronted the GWAS Jihadists, I asked them if their disbelief in the gene-environment interaction for MAOA-3R extended to a disbelief in Brunner syndrome. They defensively denied reaching that conclusion. The lesson is obvious: in order to establish the effect of MAOA-2R on violence as a trustworthy scientific finding, this allele’s effect must have an eponym. But which scientist should the disease immortalize? Will it be Guo syndrome or Beaver syndrome? (How about nooffensebut syndrome?) We could follow the example of entomologists, Quentin Wheeler and Kelly Miller, and name this after the greatest president of my lifetime: George W. Bush syndrome. However, as any graduate of medical school can attest, eponyms are evil. The study of genetics as it pertains to social sciences might gain the respectability of physics if it follows physics naming conventions. Just as flavors of quarks have creative names like strange and charm, the disease with symptoms of shooting people and stabbing people caused by the allele MAOA-2R should be called sunshine syndrome.


ResearchBlogging.org


Beaver KM, Barnes JC, & Boutwell BB (2013). The 2-Repeat Allele of the MAOA Gene Confers an Increased Risk for Shooting and Stabbing Behaviors. The Psychiatric quarterly PMID: 24326626

Piton A, Redin C, & Mandel JL (2013). XLID-causing mutations and associated genes challenged in light of data from large-scale human exome sequencing. American journal of human genetics, 93 (2), 368-83 PMID: 23871722

Tielbeek JJ, Medland SE, Benyamin B, Byrne EM, Heath AC, Madden PA, Martin NG, Wray NR, & Verweij KJ (2012). Unraveling the genetic etiology of adult antisocial behavior: a genome-wide association study. PloS one, 7 (10) PMID: 23077488

Vimaleswaran KS, Tachmazidou I, Zhao JH, Hirschhorn JN, Dudbridge F, & Loos RJ (2012). Candidate genes for obesity-susceptibility show enriched association within a large genome-wide association study for BMI. Human molecular genetics, 21 (20), 4537-42 PMID: 22791748

Sunday, December 8, 2013

The Stupid Stupidity Surrounding the Warrior Gene, MAOA, is Stupid


ResearchBlogging.org


Byrd AL, & Manuck SB (2013). MAOA, Childhood Maltreatment, and Antisocial Behavior: Meta-analysis of a Gene-Environment Interaction. Biological psychiatry PMID: 23786983

Thursday, October 24, 2013

Black Suits, Gowns, & Skin: SAT Scores by Income, Education, & Race


People with highly educated or wealthy parents score higher on the SAT than those from poor, uneducated families. Obvious statistic is obvious, but how important are dollars and degrees compared to race? The College Board, the organization that oversees the SAT, holds tight to its information on the subject, but incomplete leaks have occurred for 1995, 1997, 2003, and 2008. 1995’s top income bracket only started at $70,000, so the wealthiest African-American students that year did not outscore even the poorest white students. As shocking as that fact is, it provides no controls for confounding variables and neglects the currently largest minority, Hispanic Americans. Therefore, I decided to approach the question using multiple linear regression of state data. ("M" in the graph below stands for the math subtest. "V" stands for the critical reading or verbal subtest.)


First, I shall review the important news from this year’s SAT and ACT score reports. I used the ACT-to-SAT conversion equation that I extracted from the conversion table to construct a summary graph of overall ACT-SAT scores for each race and gender. Asian scores continued to rise, despite the College Board’s South Korean crackdown, which was based upon suspicions of widespread cheating. Meanwhile, overall scores fell, and whites, Native Americans, and men declined this year more than any of the previous sixteen available years.


Native Americans now barely score higher than Hispanic Americans. Native-American ACT scores slipped especially fast, and their average score on the optional ACT writing exam now equals those of African Americans. Since many white people have Native-American ancestry, and Canadian and US Native Americans tend to have high amounts of European ancestry, Native-American score trends could reflect changing cultural attitudes about racial identification, but their absolute number of test participants has not changed greatly.


I previously commented on evidence for possible white decline. So far, the evidence is subtle. If future scores demonstrate long-term decline, it could signify the “dumbing down” of education or culture, dysgenics, minority-centered education reforms, or low rates of whites taking test preparation services.

Because Asian score increases have been steady and measured, I believe that these represent genuine progress, even with or perhaps due to the same root causes as the reported cheating scandals among Asians. However, I suspect that Asian progress will eventually level off because most racial score gaps have stayed remarkably constant, and I think nature influences testing potential, especially among those of adequate means.

SAT annual reports provide scores of students grouped by their parents’ income and education levels. These graphs of that data should not surprise anyone.


The fluctuation of income categories tells an interesting story about the past two decades. The number of people with six-figure incomes took off not that long ago.


Despite the fact that levels of (parents’) education have been trending upwards, coming from an educated family increasingly predicts obtaining a higher SAT score. This graph of educational advantage is a Cohen’s d graph with the vertical axis zoomed in. I defined those parents with a bachelor’s or graduate degree as “educated.” (This graph uses the older term for the critical reading subtest, verbal.)


Parents’ education and income show clear links to SAT scores, but so do many other variables. When I mapped state SAT scores, I discovered that Midwestern states achieved higher scores than other states because a small percentage of studious Midwesterners took the SAT, and most other college-bound students in those states only took the ACT. Simple linear regression of state SAT scores with only participation rate as the predictor variable explains 78 percent of variance (P = 10-273). Usually psychology research conducts this kind of analysis with a sample population, but I cannot access the College Board’s raw data, obviously. I am trying to reverse-engineer an SAT database with 16 years of state data. However, a single data point for an income category could represent tens of thousands of people or as few as three. Plus, the year could potentially influence scores due to inflation or even societal changes in cognitive abilities, the so-called Flynn effect. I can appropriately control for those variables, but controlling for race would require estimation because racial group proportions are not broken down every year within each income bracket and educational degree. Therefore, I turned income and education levels into continuous variables for multiple linear regression.

For linear regression, I turned income into a continuous variable by dividing the number of students whose parents earn six-figure incomes by the number whose parents earn less than $20,000 per year. I compared results for this income “gap” to an income “divide” based on the number whose parents earn more than $60,000 per year divided by those whose parents earn less. I created a variable for education based on the number whose parents achieved at least a bachelor’s degree divided by the number whose parents did not. The racial variable was the number of whites and Asians divided by the number of another race. Simple linear regression for state population size showed that it was a significant predictor of SAT scores (P=4.3 x 10-47) that explained 22 percent of variance. However, it became insignificant with all further analysis except when the other predictor variables were either participation, year, and income gap or participation, year, education, and income divide with or without race. Year did not produce a significant P value for simple linear regression (P = 0.5) but always did in multiple linear regression of income or education, lowering scores over time like a reverse-Flynn effect. Both income gap and income divide were significant predictor variables in multiple linear regression, but income divide slightly better predicted SAT scores, explaining 86 percent of variance with year and participation variables, compared to 85 percent for income gap with year, size, and participation variables. Multiple linear regression with participation rate, year, income divide, and education explained 90 percent of variance with all variables achieving statistical significance, but the addition of education caused the P value of the income divide to worsen from 10-83 to 10-3. When I added race as an additional variable, the income divide was no longer a significant predictor of SAT scores (P = 0.4). Most of the impact of income on SAT scores stems from its ability to predict parents’ education levels. Multiple linear regression with the remaining significant variables (state sample size, participation rate, year, education, and race) explained 92 percent of SAT variance.

Graphs of actual SAT scores for income brackets and education levels show the distinctiveness of children whose parents have graduate degrees. Trendlines are given with R-squared variances for the highest and lowest categories.


The graphs for income or education with race reach the provocative result that race affects scores more among the lower rungs of society. As the data only represents state racial proportions, the results leave room for debate. For instance, the furthest left data in the graphs below represent Washington, DC, which I actually treated as a state. Higher-income families there are probably more likely to be white or Asian-American than are lower-income families. Many racially diverse states like California have industries or attractions that pull in successful, educated whites. Nevertheless, one could use these results to defend upper-class affirmative-action beneficiaries or to call for a new class-based system to benefit the many poor, but intelligent whites and Asian Americans.


Also of note is the fact that these graphs look totally awesome.


ResearchBlogging.org


Anonymous (1998). Why Family Income Differences Don't Explain the Racial Gap in SAT Scores The Journal of Blacks in Higher Education (20), 6-8 DOI: 10.2307/2999198

Anonymous (2008). Why Family Income Differences Don't Explain the Racial Gap in SAT Scores The Journal of Blacks in Higher Education (62), 10-12

Ezekiel Dixon-Roman, Howard Everson, & John McArdle (2013). Race, Poverty and SAT Scores: Modeling the Influences of Family Income on Black and White High School Students’ SAT Performance Teachers College Record, 115 (4), 1-33