
My first encounter with this strategy was on the site of temperamental science blogger Razib Khan. He did not so much lay out a plan as call everyone retarded for not seeing how obvious it is that Asians moved left as a direct consequence of losing their religion. “It’s not even in the class of a non-obvious prediction. Rather, the description screams at you.” To bolster his argument, he began swearing.
Soon thereafter, author Charles Murray joined in. “Republicans are seen by Asians—as they are by Latinos, blacks, and some large proportion of whites—as the party of Bible-thumping, anti-gay, anti-abortion creationists.” By creationism, he means the absurd, literal interpretation of the Book of Genesis, not the process by which liberals and libertarians create new rights out of nothingness. Murray might have a point. Why could not Governor Romney have paused his gay-bashing for a proper discussion of the issue of, say, taxation policy? Come to think of it, some of my best friends are Asians, and they see the Republican Party as the party of fat-cat, universal-healthcare-bashing global-warming deniers.
So, Murray and I seem to be on the same wavelength, but then I came across a curious statement. “Politically, a college education is a wash—in the General Social Survey, almost identical proportions of college graduates identify themselves as liberals and conservatives.” Razib contends that religious beliefs recently precipitated an attitudinal shift, and Murray describes this Asian political persuasion, while postulating that education played no role. Since Murray co-wrote The Bell Curve, perhaps he has noticed the radical improvement of SAT and ACT scores among Asians that could easily rival other cultural shifts, and since he works for a conservative think tank, perhaps he understands that university culture tends to espouse a certain ideology of its own. Though Asians are so much the Other that social scientists still label them “other race,” as the General Social Survey (GSS) does, Asians nevertheless adapt well. Confucius said, “Speak with sincerity and honesty, be humble and respectful, and you will get along even if you live among the barbarians.” Chinese people are the Asian prototype of nice folks who blend with the scenery. They adopt Islamic last names in Muslim nations and Christian first names in the lands of the West. Some Asians fled Communism, as Murray noted, but the Chinese diaspora was considered a bastion of Marxist agitation just a generation ago in pre-independence Singapore. How hard is it to imagine that some Asians adapt to the university ideology? In addition, I have noted previously that high intellect is more associated with liberal values and that the SAT is an IQ test, though not by design.

Murray is mostly correct about political ideology and education. This scale of conservativism is from one to seven with four being “moderate” and one being “extremely liberal.” Only those with graduate degrees are much more liberal than people with other education levels. However, for education to be “a wash” for Republicans, should not party identification receive the attention?

Education is not “a wash,” but it appears to be the opposite of my expectations. The scale extends from zero to six with three being “independent” and zero being “strong Democrat.” Republicans sensibly educate themselves to the level of a bachelor’s degree, before seeking out the upper-middle class and a house in the suburbs. Benighted high school dropouts are more conservative than they are Republican probably because the uglier aspects of conservativism that Murray so detests define their values. Indeed, high school dropouts are the least likely to agree that humans evolved from prior species.
Now to the premise, have Asians changed their political views? Since the GSS had not been using Asian as a race in its primary race survey question, I have graphed each Asian ethnic category. For conservativism, the main trend appears to be a reduction of statistical noise as the sample size increased. Filipino-Americans had the largest sample, followed by Chinese-Americans. Japanese-Americans, with the least, had about half as many respondents as the Filipinos and Chinese. Therefore, perhaps the uptick of Chinese-American Republicanism since 2008 is a real shift to the right. The conservativism trend for this group does echo party affiliation.


The evidence for an Asian political shift in the GSS is either not there or perhaps starting towards the political right, at least for the Chinese. The survey’s most recent results were 2010, but if Khan is right about religious beliefs playing the dominant role of influencing votes or if my hypothesis was right that the academic or intellectual progress was having an effect, I would have expected many years demonstrating a political shift, barring inadequacies of the survey. Surely, the study acknowledges that Asians have advanced in their educational accomplishments.

Yes, it does. The GSS also contains Wordsum, a ten-word vocabulary test that has some correlation with intelligence. Given the very clear evidence of improvement for Asian Americans on both the SAT and the ACT, as well as the improved education levels, one would expect a positive trend for Wordsum, too.

Unfortunately, these scores show no such evidence. Any number of explanations could address the discrepancy, while allowing for one’s personal biases to enter the equation. Those with contempt for Asians could find fault with the college entrance exams or explain away SAT scores as soulless cramming endeavors. Asian defenders can point out that the GSS has a small Asian sample size of about a thousand cumulatively over 38 years rather than the SAT’s tens of thousands each year, that a short vocabulary test does not represent general intelligence as well, or that a high proportion of Asians are not native-English speakers. The scores appear unbelievably low for Asians. For instance, in 2010 the average Indian American had a lower Wordsum score than the average African American. Indian Americans have the highest household annual income of any Asian-American ethnic group at over $90,000, which is more than twice that of the average African-American family.
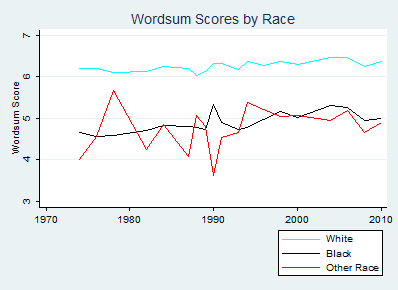
An ongoing debate in America concerns whether Hispanic people are a race or are mostly members of the white race, having Hispanic ethnicity. Since they are the largest minority, they might account for the bulk of those in the graph delineated as “other race,” whose scores seem flat and at about the level of African Americans. Ron Unz recently asserted that the GSS shows dramatic score improvement for Mexican Americans. Apparently, the blog, Inductivist, first noticed this.

Here we see Ron Unz’s “super-Flynn effect,” through which “ the Mexican-American Wordsum-IQ increased from 84.4 in the 1980s to 95.1 in the 2000s, while the rise for American whites was from 99.2 to 101.3.” Wait! I see that just prior to the super-Flynn effect an even larger super-dimming effect from 1976 to 1982 deflated Mexican-American scores in many fewer years. Likewise, Puerto Ricans’ Wordsum average fell from over five to under three in only two years! Come to think of it, Japanese Wordsum average rose six points from 1990 to 1991, (which I attribute to the release of the Violator album by Depeche Mode). The GSS sample is 4.1% Mexican-American. Mexican Americans are 10.5% of the US population. So, one can imagine that earlier decades of survey samples had small numbers for this group, which would explain the noise in the graph. This teaches the valuable lesson that graphs reveal truths better than carefully selected numbers.
If the Asian sample is not large or representative enough to properly detect shifts of voting behavior, improved intellect, or even a ballpark range of Asian intellectual abilities, I can muster little confidence in any information that I can glean for this group. However, I decided to create more detailed graphs of each Asian ethnic group for political views, Wordsum scores, and educational attainment to look for patterns. Most had none.


Despite the apparent recent trend toward conservative politics, Chinese people do not appear to have clear links between politics, education, and scores. On the political-ideology graph, notice the unwillingness of Chinese people to be extremely anything.


For Indian Americans, I do see a consistent pattern that the most educated and intelligent have recently started becoming more conservative and Republican. Consistency between graphs does not discount issues with sample size, but the recent years for Indian Americans with graduate degrees look smoother, which could reflect an increasing sample thanks to the H1B visa program. Contrast that with the noise in a graph for Japanese people.

Using Wordsum, the GSS can check the purported relationship between liberal political views and intelligence. For political ideology, the relationship presents itself. However, party affiliation appears different.


These graphs do not control for any confounding variables, and race is an obvious potential confounder. However, the associations also appear when the graphs are limited to white people, except for strong party identification in recent years.


Republicans tend to be smarter than Democrats, but liberals tend to be smarter than conservatives. Republican strategists should take note of the obvious strategy to appeal to the stupid vote. Maybe they already have. On the contrary, the party has been focusing on reaching out to minority voters, and the following graphs give some indication of the results:


The graphs are distorted by the designation of “other race” as being worth three points, whereas African Americans are worth two points. (At least it is not three-fifths.)
Minorities should be joining the GOP by the boatload, considering effusive praise like this from author Ann Coulter:
That’s why our blacks are so much better than their blacks. To become a black Republican, you don’t just roll into it. You’re not going with the flow. You have fought against probably your family members, probably your neighbors. You have thought everything out, and that’s why we have very impressive blacks in our party.According to the GSS, their blacks are actually better than her blacks. Perhaps that is changing for those who are the strongest Republicans, but the sample size for that group is likely to be very, very small.


What Republicans really hunger for is the Hispanic vote, so I present this very important graph about Mexican Americans:

At first, a pattern might not jump out, but if one stares long enough, everything makes sense. Then, if one closes one’s eyes, a photo negative of the graph will appear.
Republicans commit a basic error when envisioning Hispanic Americans or African Americans as “natural conservatives” in that they conflate conservativism and Republicanism. Minorities tend to identify with conservativism much more than the Republican Party.


For some, the vagueness or emptiness of the term conservative might allow for posturing about values or lifestyle. Still others actually embody the vulgar close-minded thinking and parochialism that puts off Murray. It helps to consider how some socially conservative beliefs are natural reactions to some unhealthy societal changes, and values that sustain a family contrast with the blandness of haggling over the budgetary pie for already well-off interests. Confucianism serves as a fine example of an Asian social philosophy that contrasts with the libertarian, Randian individualism. Murray is right to defend science and reason, but the best strategy to win the votes of Asians and others is an intelligent populism.


